


Today’s report: The bad news is good news trade
Market conditions will thin out dramatically from now through the end of the week on account of the US Thanksgiving holiday break. As things stand, it’s been a softer batch of US economic data and some dovish Fed speak that have driven a lot of the flow this week.
Wake-up call
- ECB Vasle
- Supreme Court
- inflation data
- RBA Lowe
- Falling oil
- Hawkish tone
- Inflation headache
- Dealers report
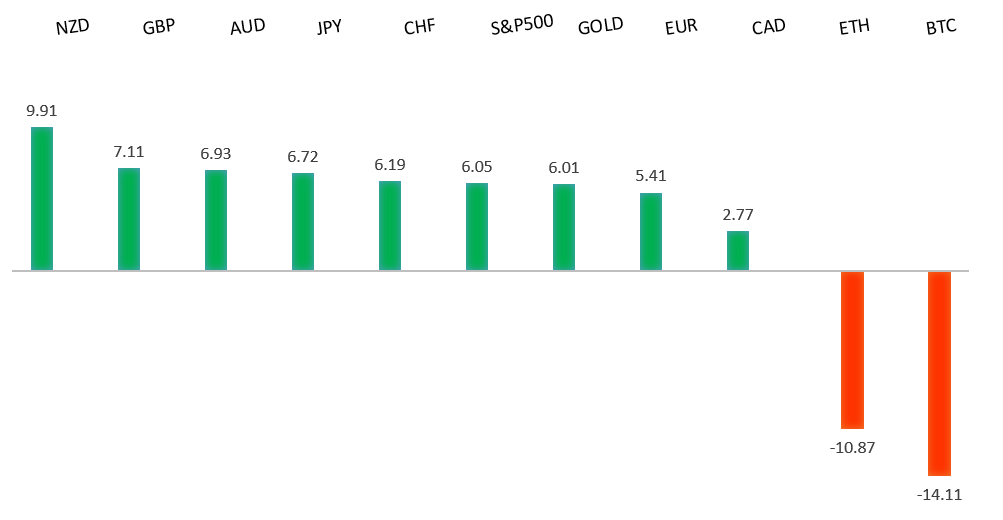
Peformance chart: 30 Day Performance vs. US dollar (%)
Suggested reading
- Pressure on the Hong Kong Dollar Peg Keeps Building, R. Cookson, Bloomberg (November 23, 2022)
- Inside London's 'Zero Waste' Restaurant, D. Garrahan, Financial Times (November 24, 2022)
Chart talk: Technical & fundamental highlights
Choose pair:
EURUSD – technical overview
A break back above important resistance at 1.0200 suggests the market could be in the process of carving out a longer-term base after sinking to a multi-year low. Look for any setbacks to now be well supported ahead of 0.9900, with only a break back below 0.9730 to compromise the shifting outlook. Next key resistance comes in by previous support at 1.0636.EURUSD – fundamental overview
The Euro continues to track higher, mostly on the back of broad based US Dollar selling. We've also seen demand from slightly better Eurozone PMI reads and hawkish comments from ECB Vasle after the central banker called for a large hike next month. Key standouts on Thursday’s calendar come from German Ifo reads, BOE and ECB speak, UK CBI trends, and the ECB Minutes.EURUSD - Technical charts in detail
GBPUSD – technical overview
Signs have emerged of the market wanting to put in a longer-term base after collapsing to a record low in September. The latest weekly close back above the September high at 1.1739 strengthens this prospect. Any setbacks should now be well supported ahead of 1.1100. Next key resistance comes in at 1.2294.GBPUSD – fundamental overview
The Pound has been outperforming on the back of the UK Supreme Court nixing a Scottish independence referendum. Meanwhile, UK PMI reads improved and BOE Pill talked about more rate hikes being needed. Key standouts on Thursday’s calendar come from German Ifo reads, BOE and ECB speak, UK CBI trends, and the ECB Minutes.USDJPY – technical overview
Longer-term technical studies are in the process of unwinding from severe overbought readings. Look for additional corrective price action back down towards the 130.00 area before the market considers the possibility of uptrend resumption. Rallies should now be well capped ahead of 147.00.USDJPY – fundamental overview
The Yen has been better bid this week, getting a boost from the combination of hotter Japan inflation data and more dovish leaning Fed speak. Key standouts on Thursday’s calendar come from German Ifo reads, BOE and ECB speak, UK CBI trends, and the ECB Minutes.AUDUSD – technical overview
There are signs of the potential formation of a longer-term base following the recent surge back above 0.6500. The latest weekly close back above previous support now turned resistance at 0.6682 strengthens the outlook for a bullish structural shift.AUDUSD – fundamental overview
RBA Lowe was out the other day talking monetary policy outlook, saying policy was not on pre-set path and the central bank may resume outsized hikes. This along with a recovery in the RMB and dovish Fed speak helped to prop Aussie. Key standouts on Thursday’s calendar come from German Ifo reads, BOE and ECB speak, UK CBI trends, and the ECB Minutes.USDCAD – technical overview
A recent surge back above 1.3000 signals an end to a period of bearish consolidation and suggests the market is in the process of carving out a more significant longer-term base. Next key resistance now comes in up into the 1.4000 area. Setbacks should be very well supported down into the 1.3000 area.USDCAD – fundamental overview
The Canadian Dollar has been lagging its peer group, despite making mild gains against the Buck. The relative weakness has been driven off the slide in oil prices. Key standouts on Thursday’s calendar come from German Ifo reads, BOE and ECB speak, UK CBI trends, Canada weekly earnings, and the ECB Minutes.NZDUSD – technical overview
Overall pressure remains on the downside with risk for the current recovery rally to stall out and form a lower top for the next major downside extension. A break back above 0.6469 would be required to take the immediate pressure off the downside.NZDUSD – fundamental overview
The New Zealand Dollar has been outperforming this week in the aftermath of an RBNZ 75 basis point rate hike and accompanying hawkish communication in which it was revealed the central bank was even considering a 100 bp move and a shift higher in its peak OCR estimates to 5.50% in Q3 2023, from 4.10% in Q2 2023. Key standouts on Thursday’s calendar come from German Ifo reads, BOE and ECB speak, UK CBI trends, and the ECB Minutes.US SPX 500 – technical overview
Longer-term technical studies are in the process of unwinding from extended readings off record highs. Look for rallies to be well capped in favor of lower tops and lower lows. A monthly close back above 4000 will be required at a minimum to take the immediate pressure off the downside. Next major support comes in around 3200.US SPX 500 – fundamental overview
We've finally reached a point in the cycle where the Fed recognizes unanchored inflation expectations pose a greater downside risk than over-tightening. This is significant, as it means less investor friendly monetary policy that risks potential recession in the months ahead. Overall, we expect inflation to continue to be a problem in Q4 2022 and Q1 2023 that results in downside pressure into rallies.GOLD (SPOT) – technical overview
The 2019 breakout above the 2016 high at 1375 was a significant development, opening the door for fresh record highs. Setbacks should now be well supported above 1600 on a monthly close basis ahead of the next major upside extension. Back above 1808 will strengthen the bullish outlook.GOLD (SPOT) – fundamental overview
The yellow metal continues to be well supported on dips with solid demand from medium and longer-term accounts. These players are more concerned about inflation risk and a less upbeat global growth outlook. All of this should keep the commodity well supported, with many market participants also fleeing to the hard asset as the grand dichotomy of record high equities and record low yields comes to an unnerving climax.