


Next 24 hours: Kashkari fuels more US Dollar demand
Today’s report: Yield differentials continue to lean to US Dollar
The market is back to worrying about slowing growth in the US, though this hasn’t been enough to inspire much change in overall price action. Indeed, year-end Fed funds trade at 4.65%, versus Fed forecasts of 5.1%. But ultimately, the Fed has continued to go against the will of the market.
Wake-up call
- dovish comments
- sales data
- USDJPYJapanese government adds to soft Yen
- China property
- rate expectations
- stronger data
- Policy outlook
- Dealers report
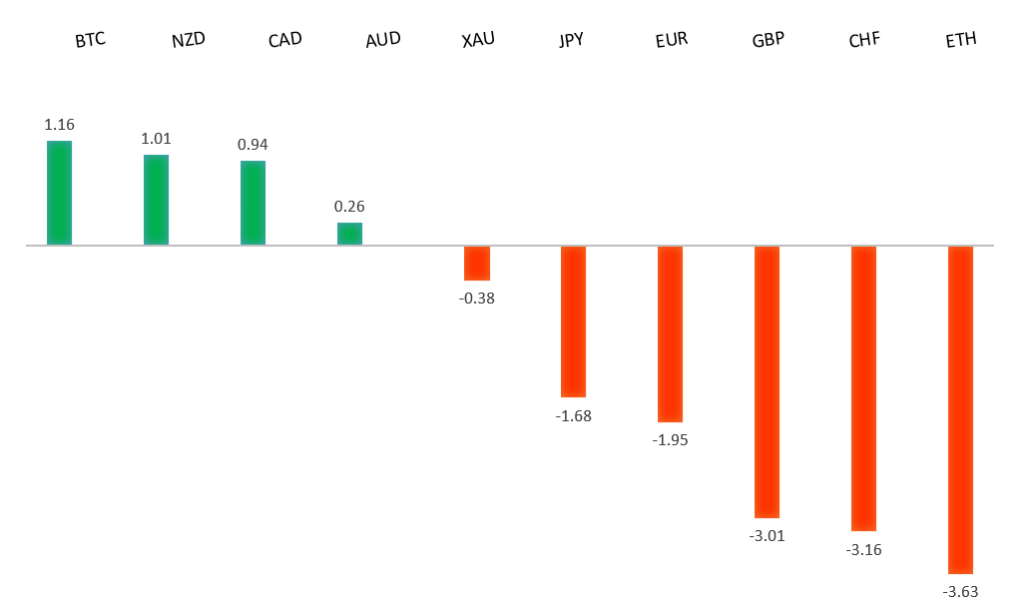
Peformance chart: 30 Day Performance vs. US dollar (%)
Suggested reading
- High-Frequency Traders Want Low-Frequency Radio Waves, A. Brown, Bloomberg (September 21, 2023)
- How Farmers Can Cut Emissions, A. Mooney, Financial Times (September 26, 2023)
Chart talk: Technical & fundamental highlights
Choose pair:
EURUSD – technical overview
The Euro remains well supported on dips following a run to the topside through 1.1000. Any additional setbacks should be well supported ahead of 1.0500 in favor of a bullish continuation. Ultimately, only a monthly close back below 1.0500 would give reason for concern. Next key resistance comes in the form of the 2023 high at 1.1276.EURUSD – fundamental overview
The Euro has extended its run of declines on a fresh round of dovish ECB comments. ECB Lagarde said that while the central bank wasn't talking rate cuts, the damage was done, while ECB Villeroy echoed this sentiment, expressing fear over the risk of raising rates further. Meanwhile German IFO declined for a fifth month, while the current assessment dropped to a post pandemic low. The local rate market is pricing peak rates at current levels. Key standouts on Tuesday’s calendar come from and ECB Lane speech, Canada manufacturing sales, US housing data, US consumer confidence, and Dallas Fed manufacturing.EURUSD - Technical charts in detail
GBPUSD – technical overview
Signs have emerged of the market wanting to put in a longer-term base after collapsing to a record low in September 2022. The November 2022 monthly close back above 1.2000 strengthens this prospect. Any setbacks should now be well supported ahead of 1.2000. Next key resistance comes in at 1.3143.GBPUSD – fundamental overview
The Pound didn't get much help from Monday's round of better UK sales data. The currency is still struggling with last week's BOE rate hold and broad based US Dollar demand. Key standouts on Tuesday’s calendar come from and ECB Lane speech, Canada manufacturing sales, US housing data, US consumer confidence, and Dallas Fed manufacturing.USDJPY – technical overview
At this stage, it looks like the market is wanting to resume the bigger picture uptrend and head back towards a retest of that multi-year high from October 2022 up at 151.95. Look for any weakness to continue to be well supported on dips.USDJPY – fundamental overview
The Yen remains under pressure at fresh yearly lows against the Buck in the aftermath of last Friday's dovish BOJ decision. Adding insult to injury, the Japanese government has turned to even more fiscal spending to ease inflation pain. Key standouts on Tuesday’s calendar come from and ECB Lane speech, Canada manufacturing sales, US housing data, US consumer confidence, and Dallas Fed manufacturing.AUDUSD – technical overview
There are signs of the potential formation of a longer-term base with the market trading down into a meaningful longer-term support zone. Only a monthly close below 0.6400 would give reason for rethink. Back above 0.6523 will take the immediate pressure off the downside and strengthen case for a bottom.AUDUSD – fundamental overview
The Australian Dollar remains under pressure on the back of the latest China property sector woes. Key standouts on Tuesday’s calendar come from and ECB Lane speech, Canada manufacturing sales, US housing data, US consumer confidence, and Dallas Fed manufacturing.USDCAD – technical overview
Above 1.3000 signals an end to a period of longer-term bearish consolidation and suggests the market is in the process of carving out a more significant longer-term base. Next key resistance now comes in up into the 1.4000 area. Setbacks should be very well supported down into the 1.3000 area.USDCAD – fundamental overview
The Canadian Dollar has managed to outperform against its peers on higher odds for a Bank of Canada rate hike. However, this hasn't helped the Canadian Dollar against the Buck in the aftermath of a hawkish leaning Fed decision which has triggered broad US Dollar demand and downside pressure on risk assets. Key standouts on Tuesday’s calendar come from and ECB Lane speech, Canada manufacturing sales, US housing data, US consumer confidence, and Dallas Fed manufacturing.NZDUSD – technical overview
Overall pressure remains on the downside with the market once again stalling out on a run up into the 0.6500 area. Ultimately, a break back above 0.6015 would be required to take the immediate pressure off the downside. A monthly close below 0.6000 would intensify bearish price action.NZDUSD – fundamental overview
Though the New Zealand Dollar remains weighed down on broad based US Dollar demand and risk off flow, the currency has held up better than its commodity currency cousins in recent sessions, perhaps on sustained momentum from last week's better than expected Thursday Kiwi GDP report. Key standouts on Tuesday’s calendar come from and ECB Lane speech, Canada manufacturing sales, US housing data, US consumer confidence, and Dallas Fed manufacturing.US SPX 500 – technical overview
Longer-term technical studies are in the process of unwinding from extended readings off record highs. Look for rallies to be well capped in favor of lower tops and lower lows. A monthly close back above 4600 will be required to take the immediate pressure off the downside. Next key support comes in at 4257.US SPX 500 – fundamental overview
We've finally reached a point in the cycle where the Fed recognizes unanchored inflation expectations pose a greater downside risk than over-tightening. This is significant, as it means less investor friendly monetary policy, especially with the growth outlook looking up in recent months. Overall, we expect inflation to continue to be a problem in 2023 that results in downside pressure into rallies despite market expectations that would argue otherwise.GOLD (SPOT) – technical overview
The 2019 breakout above the 2016 high at 1375 was a significant development, opening the door for fresh record highs. Setbacks should now be well supported above 1600 on a monthly close basis ahead of the next major upside extension. Next major resistance comes in at 2100, above which opens the next extension towards 2500.GOLD (SPOT) – fundamental overview
The yellow metal continues to be well supported on dips with solid demand from medium and longer-term accounts. These players are more concerned about inflation risk and a less upbeat global growth outlook. All of this should keep the commodity well supported, with many market participants also fleeing to the hard asset as the grand dichotomy of record high equities and record low yields comes to an unnerving climax.