


Next 24 hours: US market on holiday; ECB Minutes in focus
Today’s report: Currencies more cautious than stocks
Currencies and stocks are once again seemingly at odds over their interpretation of US economic data and the impact on monetary policy. Key standouts on Thursday’s calendar come from German, Eurozone, UK PMI reads, and Canada wholesale sales. The US market is closed for the Thanksgiving holiday.
Wake-up call
- court ruling
- Budget statement
- growth forecasts
- China woes
- BoC Macklem
- CB decision
- ignoring Fed
- Global outlook
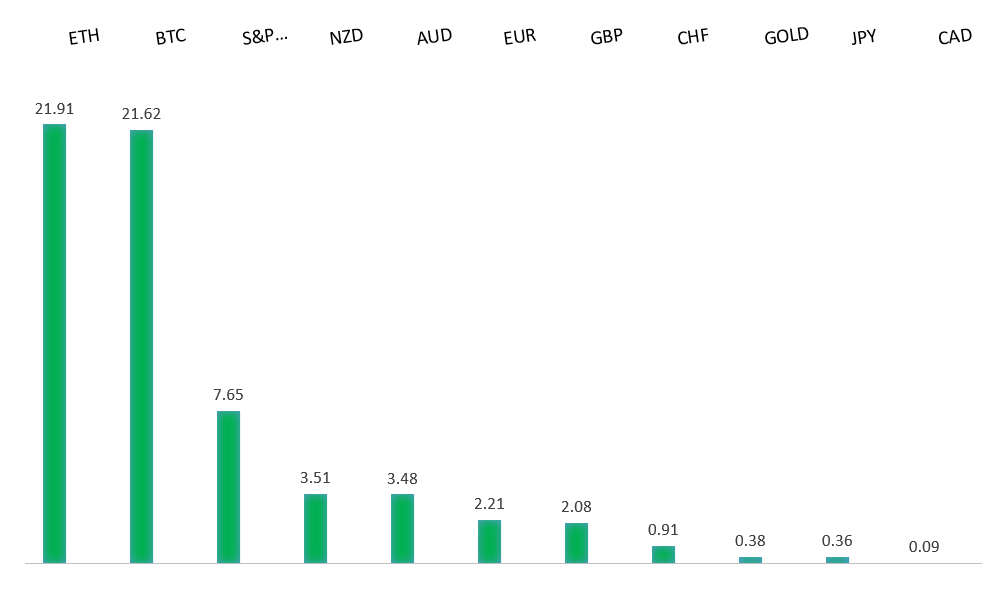
Peformance chart: 30 Day Performance vs. US dollar (%)
Suggested reading
- A Good Sign Stocks Have a Wall of Worry to Climb, Fisher Investments (November 16, 2023)
- The Cult of the Founder CEO, Financial Times (November 23, 2023)
Chart talk: Technical & fundamental highlights
Choose pair:
EURUSD – technical overview
The Euro has been in a multi-month consolidation since bottoming out in 2022. Setbacks have since been exceptionally well supported on dips below 1.0500, with a higher platform sought out ahead of the next major upside extension. Look for a push through the yearly high at 1.1276 to strengthen the constructive outlook and extend the recovery run towards 1.2000. Only back below 1.0400 negates.EURUSD – fundamental overview
The Euro came under some pressure on Wednesday, contending with fallout from the German court ruling that froze federal spending. This has left the German government with a hard decision to go with budget cuts or higher taxes. At the same time, setbacks were somewhat mitigated on the improved Eurozone sentiment and confidence reads. Key standouts on Thursday’s calendar come from German, Eurozone, UK PMI reads, and Canada wholesale sales. The US market is closed for the Thanksgiving holiday.EURUSD - Technical charts in detail
GBPUSD – technical overview
Signs have emerged of the market wanting to put in a longer-term base after collapsing to a record low in September 2022. The November 2022 monthly close back above 1.2000 strengthens this prospect. Any setbacks should now be well supported ahead of 1.2000. Next key resistance comes in at 1.2681.GBPUSD – fundamental overview
UK markets were left unimpressed with the Autumn Budget statement. The expected improvement in public finances is seen as unsustainable, while the structure of tax incentives isn't viewed as enough to stoke demand. Meanwhile, OBR has downgraded growth forecasts and UK CBI manufacturing orders plunged to a post pandemic low. Key standouts on Thursday’s calendar come from German, Eurozone, UK PMI reads, and Canada wholesale sales. The US market is closed for the Thanksgiving holiday.USDJPY – technical overview
The market remains confined to a strong uptrend, with sights set on a retest and break of the multi-year high from 2022 at 151.95. A push through this level will open the next major upside extension towards 155.00. Key support comes in at 147.00, with only a daily close below to delay the constructive outlook.USDJPY – fundamental overview
The Yen came under added pressure on Wednesday after the Japanese government cut growth forecasts for the first time in ten months. Key standouts on Thursday’s calendar come from German, Eurozone, UK PMI reads, and Canada wholesale sales. The US market is closed for the Thanksgiving holiday.AUDUSD – technical overview
There are signs of the potential formation of a longer-term base with the market trading down into a meaningful longer-term support zone. Only a monthly close below 0.6200 would give reason for rethink. Back above 0.6630 will take the immediate pressure off the downside and strengthen case for a bottom.AUDUSD – fundamental overview
The Australian Dollar hasn't been all that convinced by RBA Governor Bullock's hawkish warning on Wednesday. Instead, the currency has run into resistance on weakness in metals prices, and Chinese markets failing to get any traction from the latest China lending pledge. Key standouts on Thursday’s calendar come from German, Eurozone, UK PMI reads, and Canada wholesale sales. The US market is closed for the Thanksgiving holiday.USDCAD – technical overview
Above 1.3000 signals an end to a period of longer-term bearish consolidation and suggests the market is in the process of carving out a more significant longer-term base. Next key resistance now comes in up into the 1.4000 area. Setbacks should be very well supported down into the 1.3000 area.USDCAD – fundamental overview
The Canadian Dollar hasn't gotten any help from the latest Bank of Canada Macklem comments after the central banker said rates may be restrictive enough and that he expected a weak economy to bring downward pressure on inflation. Key standouts on Thursday’s calendar come from German, Eurozone, UK PMI reads, and Canada wholesale sales. The US market is closed for the Thanksgiving holiday.NZDUSD – technical overview
Overall pressure remains on the downside with the market once again stalling out on a run up into the 0.6500 area. At the same time, there are some signs of the market wanting to put in a longer-term base. Ultimately, a break back above 0.6133 would be required to take the immediate pressure off the downside and encourage this prospect. A monthly close below 0.5800 will intensify bearish price action.NZDUSD – fundamental overview
New Zealand Dollar gains are running into resistance into the end of the week, perhaps as traders start to position into next week's RBNZ decision. The market is pricing no change to policy. Key standouts on Thursday’s calendar come from German, Eurozone, UK PMI reads, and Canada wholesale sales. The US market is closed for the Thanksgiving holiday.US SPX 500 – technical overview
Longer-term technical studies are in the process of unwinding from extended readings off record highs. Look for rallies to be well capped in favor of lower tops and lower lows. A monthly close back above 4600 will be required to take the immediate pressure off the downside. Next key support comes in at 4308.US SPX 500 – fundamental overview
Investors continue to struggle with the reality of a higher for longer Fed policy track in the face of ongoing worry around inflation, while also contending with geopolitical risk in 2023. Overall, we expect inflation to continue to be a problem in 2023 that results in downside pressure into rallies despite recent data and market expectations that would argue otherwise.GOLD (SPOT) – technical overview
The 2019 breakout above the 2016 high at 1375 was a significant development, opening the door for fresh record highs. Setbacks should now be well supported above 1600 on a monthly close basis ahead of the next major upside extension. Next major resistance comes in at 2100, above which opens the next extension towards 2500.GOLD (SPOT) – fundamental overview
The yellow metal continues to be well supported on dips with solid demand from medium and longer-term accounts. These players are more concerned about inflation risk and a less stable and upbeat global growth outlook. All of this should keep the commodity well supported, with many market participants also fleeing to the hard asset as the grand dichotomy of record high equities and record low yields comes to an unnerving climax.