


Today’s report: Doom and gloom into the end of the week
Investors have become more distressed into the end of the week, and this distressed sentiment has translated to some very clear risk off flow opening renewed demand for the US Dollar and downside pressure on US equities.
Wake-up call
- September cut
- wages cool
- Japan CPI
- jobs report
- retail sales
- sentiment deteriorates
- Fed outlook
- Macro themes
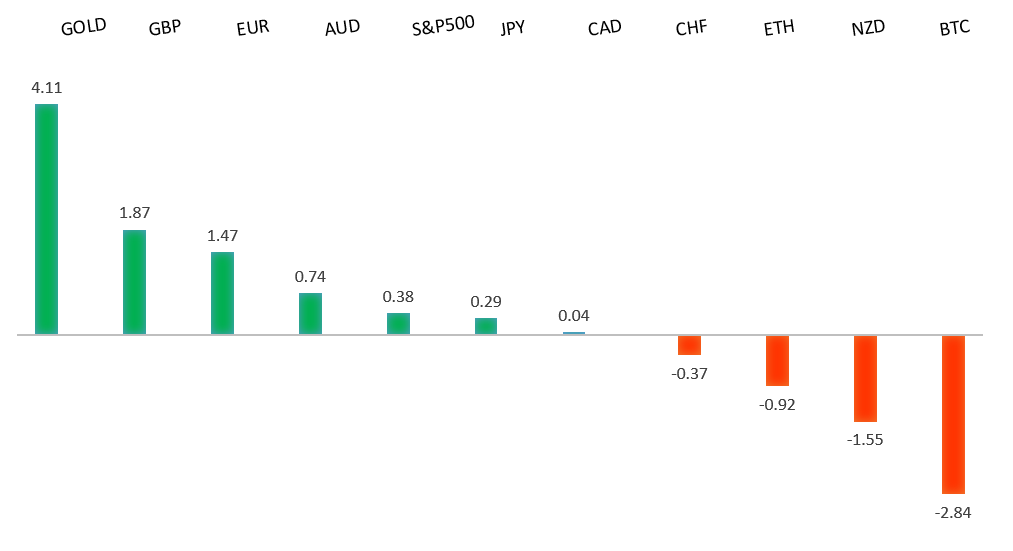
Peformance chart: 30-Day Performance vs. US dollar (%)
Suggested reading
- Who Killed the ESG Party?, D. Garrahan, Financial Times (July 17, 2024)
- Insights on Stocks, Bonds & The Economy, D. Sekera, Morningstar (July 15, 2024)
Chart talk: Technical & fundamental highlights
Choose pair:
EURUSD – technical overview
The Euro has been in a multi-month consolidation since bottoming out in 2022. Setbacks have since been exceptionally well supported on dips below 1.0500, with a higher platform sought out ahead of the next major upside extension. Look for a push through the 2023 high at 1.1276 to strengthen the constructive outlook and extend the recovery run towards 1.2000. Only back below 1.0400 negates.EURUSD – fundamental overview
The ECB decision leaned to the dovish side and the Euro took a clear hit in the aftermath. The central bank set the stage for a September rate cut, while talking lower inflation and risks tilted to the downside on growth. Market odds for a September cut have jumped to about 80%. Meanwhile, Eurozone construction output didn't help matters after falling to the lowest level since February 2021. Key standouts on Friday’s calendar come from German producer prices, UK retail sales and public borrowing, the Eurozone current account, Canada retail sales and producer prices, and a round of Fed speak.EURUSD - Technical charts in detail
GBPUSD – technical overview
Signs have emerged of the market wanting to put in a longer-term base after collapsing to a record low in September 2022. The door is now open for the next major upside extension towards the 2023 high at 1.3143. Any setbacks should be well supported ahead of 1.2500.GBPUSD – fundamental overview
UK unemployment held steady, but a cooling off in wages was enough to turn heads and force a repricing of GBP bets, with the UK currency cooling off in the aftermath. Key standouts on Friday’s calendar come from German producer prices, UK retail sales and public borrowing, the Eurozone current account, Canada retail sales and producer prices, and a round of Fed speak.USDJPY – technical overview
The market remains confined to a strong uptrend, most recently extending to a multi-year high through 160.00. Key support comes in at 151.95, with only a weekly close below to delay the constructive outlook. Next major resistance comes in at 165.00.USDJPY – fundamental overview
It feels like the Yen has run about as much as it can right now, after enjoying a multi-session recovery. The market's attention has shifted back to yield differentials that continue to lean in the Buck's favor. Key standouts on Friday’s calendar come from Japan CPI, German producer prices, UK retail sales and public borrowing, the Eurozone current account, Canada retail sales and producer prices, and a round of Fed speak.AUDUSD – technical overview
There are signs of the potential formation of a longer-term base with the market trading down into a meaningful longer-term support zone. Only a monthly close below 0.6200 would give reason for rethink. Back above 0.6900 will take the big picture pressure off the downside and strengthen case for a bottom.AUDUSD – fundamental overview
The Australian Dollar tried as hard as it could to hold up on Thursday after taking in a better than expected jobs report. However, it was a wave of risk off flow that could not be ignored, which ultimately forced the currency lower on the day. Key standouts on Friday’s calendar come from German producer prices, UK retail sales and public borrowing, the Eurozone current account, Canada retail sales and producer prices, and a round of Fed speak.USDCAD – technical overview
Above 1.3000 signals an end to a period of longer-term bearish consolidation and suggests the market is in the process of carving out a more significant longer-term base. Next key resistance now comes in up into the 1.4000 area. Setbacks should be very well supported down into the 1.3000 area.USDCAD – fundamental overview
Commodities have been under pressure in recent sessions, all while Canada economic data has been struggling on the whole. We've also now seen a downturn in US equities, and all of this has been weighing on the Canadian Dollar. Key standouts on Friday’s calendar come from German producer prices, UK retail sales and public borrowing, the Eurozone current account, Canada retail sales and producer prices, and a round of Fed speak.NZDUSD – technical overview
Overall pressure remains on the downside with the market continuing to stall out on runs up into the 0.6500 area. At the same time, there are some signs of the market wanting to put in a longer-term base. Ultimately, a break back above 0.6500 would be required to take the medium-term pressure off the downside and encourage this prospect. A monthly close below 0.5800 will intensify bearish price action.NZDUSD – fundamental overview
Most of the latest round of setbacks in the New Zealand Dollar have been attributed to the downturn in US equities and global sentiment. Key standouts on Friday’s calendar come from German producer prices, UK retail sales and public borrowing, the Eurozone current account, Canada retail sales and producer prices, and a round of Fed speak.US SPX 500 – technical overview
Longer-term technical studies continue to look quite extended, begging for a deeper correction ahead. The latest rally has extended to reach and even exceed a 355 point measured move extension target objective in the 5,640 area, adding to the case for an imminent correction. At this stage, additional upside should be limited to allow for overbought studies to unwind. There is now room for a pullback towards previous resistance turned support in the form of the previous record high from April around 5,290.US SPX 500 – fundamental overview
Though we have seen a healthy adjustment of investor expectations towards the amount of rate cuts in 2024, the market still hopes policy will end up erring more towards the investor friendly, accommodative side of things. This bet has kept stocks well bid into dips and consistently pushing record highs. Still, if there is a sense the Fed will need to be more sensitive towards erring on the side of higher rates, it could invite major disruption to the stock market.GOLD (SPOT) – technical overview
The 2019 breakout above the 2016 high at 1375 was a significant development, opening the door for fresh record highs and this next major upside extension into the 2500-3000 area. Setbacks should now be well supported above 2200 on a monthly close basis.GOLD (SPOT) – fundamental overview
The yellow metal has pushed record highs in 2024 with solid demand from medium and longer-term accounts. These players are more concerned about inflation, geopolitical risk and a less upbeat global growth outlook. All of this should keep the commodity well supported, with many market participants also fleeing to the hard asset as the grand dichotomy of record high equities and record low yields comes to an end.