


Next 24 hours: US equity futures pointing south
Today’s report: Dollar recovers after impressive US jobs report
We come into the new week with the market still digesting the latest employment report out of the US. The robust across the board data has been enough to shake out plenty of Dollar shorts as Fed rate expectations for a November cut sink back down to 25 basis points versus 50.
Wake-up call
- data overshadowed
- UK construction
- Yield differential
- Monday holiday
- Ivey PMI
- Shadow Board
- accommodative policy
- Macro themes
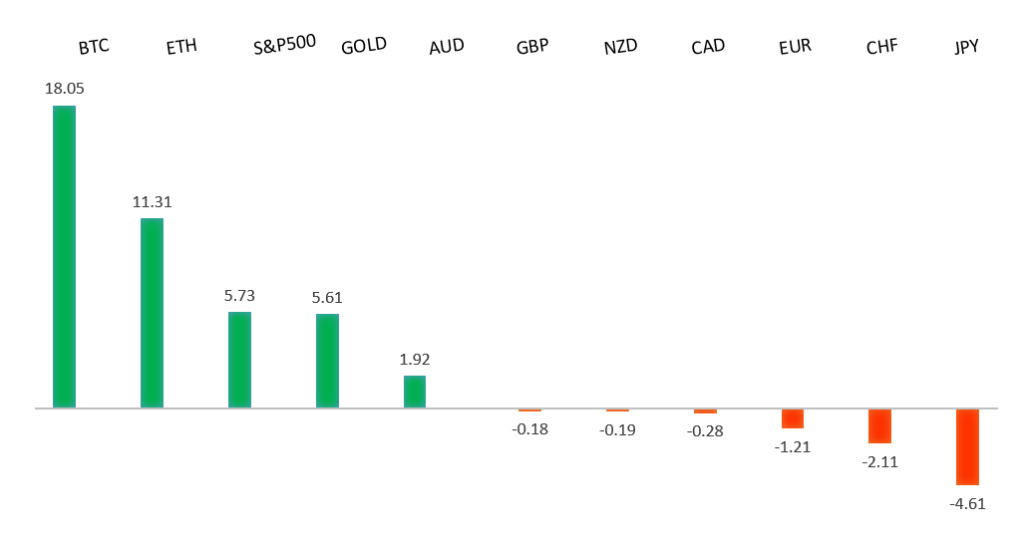
Peformance chart: 30-Day Performance vs. US dollar (%)
Suggested reading
- Smart People Prefer Passive, R. Wigglesworth, FT Alphaville (October 2, 2024)
- Recruitment is Broken, What Are Businesses Doing to Fix It?, C. Justin, Financial Times (October 7, 2024)
Chart talk: Technical & fundamental highlights
Choose pair:
EURUSD – technical overview
The Euro has been in a multi-month consolidation since bottoming out in 2022. Setbacks have since been exceptionally well supported on dips below 1.0500, with a higher platform sought out ahead of the next major upside extension. Look for a push through the 2023 high at 1.1276 to strengthen the constructive outlook and extend the recovery run towards 1.2000. Only back below 1.0400 negates.EURUSD – fundamental overview
Euro area construction data came in better than expected to close out the week, though this wasn't enough to support the single currency with stale longs heading for the exit. A lot of this had to do with the strong employment report out of the US, which inspired broad based Dollar demand. Key standouts on Wednesday’s calendar come from Eurozone unemployment, ECB speak, US ADP employment, and Fed speak.EURUSD - Technical charts in detail
GBPUSD – technical overview
Signs have emerged of the market wanting to put in a longer-term base after collapsing to a record low in September 2022. The door is now open for the next major upside extension towards the 2018 high at 1.4377. Any setbacks should be well supported ahead of 1.2500.GBPUSD – fundamental overview
The Pound has done an exceptional job outperforming despite broad based Dollar demand post Friday's strong US jobs report. The primary catalyst for the outperformance comes from the hottest UK construction PMI read in more than two years. Key standouts on Wednesday’s calendar come from Eurozone unemployment, ECB speak, US ADP employment, and Fed speak.USDJPY – technical overview
The market has entered a period of correction after extending the uptrend to a multi-year high through 160.00. Critical support comes in around 140.00, with only a monthly close below the barrier to compromise the bullish outlook. A higher low is ideally sought out above 140.00 in favor of a bullish continuation. A weekly close back above 150.00 will hint at the start to longer-term uptrend resumption.USDJPY – fundamental overview
The combination of the emergence of more dovish speak out of Japan and a very strong US jobs report has been a combination driving this latest wave of Yen weakness as yield differentials move back towards the Buck. Key standouts on Wednesday’s calendar come from Eurozone unemployment, ECB speak, US ADP employment, and Fed speak.AUDUSD – technical overview
There are signs of the potential formation of a longer-term base with the market trading down into a meaningful longer-term support zone. Only a monthly close below 0.6200 would give reason for rethink. A monthly close back above 0.7000 will take the big picture pressure off the downside and strengthen case for a bottom.AUDUSD – fundamental overview
The Australian Dollar is trying to recover on some hotter MI inflation reads, though trading activity has been thin on account of an Australia closure for holiday. Key standouts on Wednesday’s calendar come from Eurozone unemployment, ECB speak, US ADP employment, and Fed speak.USDCAD – technical overview
A sustained hold above 1.3000 over the past several months signals an end to a period of longer-term bearish consolidation and suggests the market is in the process of carving out a more significant longer-term base. Next key resistance now comes in up into the 1.4000 area, with a break to open a retest of the 2020 high just ahead of 1.4700. Setbacks should be very well supported down into the 1.3000 area.USDCAD – fundamental overview
The Canadian Dollar couldn't ignore the strong US employment report, but was able to find some relative strength on the back of an impressive Canada Ivey PMI print which jumped back into expansion territory to 53.1 from 48.2 previous. Key standouts on Wednesday’s calendar come from Eurozone unemployment, ECB speak, US ADP employment, and Fed speak.NZDUSD – technical overview
Overall pressure remains on the downside with the market continuing to stall out on runs up into the 0.6500 area. At the same time, there are some signs of the market wanting to put in a longer-term base. Ultimately, a break back above 0.6500 would be required to take the medium-term pressure off the downside and encourage this prospect. A monthly close below 0.5800 will intensify bearish price action.NZDUSD – fundamental overview
The NZIER's Shadow Board is divided on whether or not the RBNZ will cut 25 or 50bps later this week. There had been a strong expectation heading in for 50 basis points and this latest news could be translating to some profit taking on Kiwi shorts ahead of the Wednesday event risk. Key standouts on Wednesday’s calendar come from Eurozone unemployment, ECB speak, US ADP employment, and Fed speak.US SPX 500 – technical overview
The longer term uptrend remains intact and dips continue to be exceptionally well supported. Critical support comes in at 5093, with only a break back below this level to compromise the structure and open the door for a more significant corrective decline. Until then, the focus remains on a continued push to fresh record highs.US SPX 500 – fundamental overview
The US equities market remains exceptionally well supported in 2024 on the back of an ongoing expectation for more rate cuts than less going forward. Investors are feeling better about a soft landing in the US economy and this has also been accompanied by an accommodative adjustment of Fed policy. It will however be important to keep an eye on inflation, bigger picture economic data, US election and geopolitical risk in the weeks and months ahead.GOLD (SPOT) – technical overview
The 2019 breakout above the 2016 high at 1375 was a significant development, opening the door for fresh record highs and this next major upside extension into the 2500-3000 area. Setbacks should now be well supported above 2300 on a monthly close basis.GOLD (SPOT) – fundamental overview
The yellow metal has pushed record highs in 2024 with solid demand from medium and longer-term accounts. These players are more concerned about inflation, geopolitical risk and a less upbeat global growth outlook. All of this should keep the commodity well supported over the coming months.