


Today’s report: A diffusion in tension
Trading conditions will be thinner today on account of the long weekend holiday in the US. But as we come into the new week, sentiment is rather upbeat. Most of this has been driven off a diffusion in tension around US trade policy and optimism around a possible peace deal between Russia and the Ukraine.
Wake-up call
- Eurozone trade
- positions unwound
- Japan GDP
- RBA cut
- housing starts
- retail sales
- Trump policies
- Macro themes
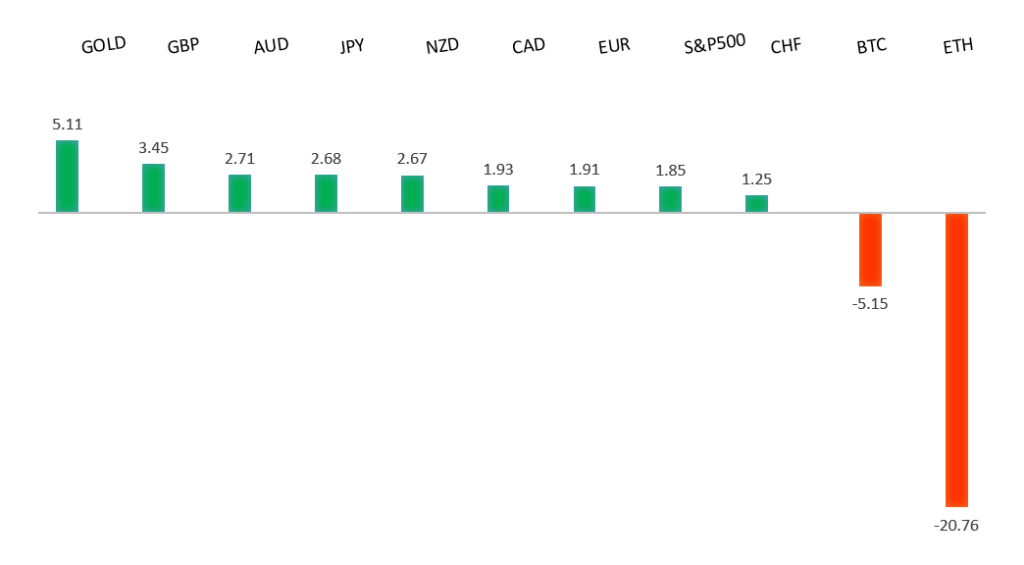
Peformance chart: 30-Day Performance vs. US dollar (%)
Suggested reading
- The Dot Com Bubble Popped 25 Years Ago. Is AI Next?, R. Forsyth, Barrons (February 14, 2025)
- Why 24-Hour Trading Might Be a Bad Idea for Investors, S. Lamas, Morningstar (February 15, 2025)
Chart talk: Technical & fundamental highlights
Choose pair:
EURUSD – technical overview
The Euro has been in a multi-month consolidation since bottoming out in 2022. Setbacks have since been exceptionally well supported on dips towards parity, with a higher platform sought out ahead of the next major upside extension. Look for a major bounce in the days ahead and the start to a push back towards the 2023 high at 1.1276. Only a monthly close below 1.0000 negates.EURUSD – fundamental overview
Last Friday's Eurozone GDP data was well received, while the single currency continues to feel better about possible peace between Russia and the Ukraine. Trade tensions have also cooled off, providing another prop. Key standouts on Monday’s calendar come from Eurozone trade, Canada housing starts, Canada foreign securities purchases, and Fed speak. US markets are closed for Presidents Day.EURUSD - Technical charts in detail
GBPUSD – technical overview
Signs have emerged of the market wanting to put in a longer-term base after collapsing to a record low in September 2022. The door is now open for the next major upside extension towards the 2018 high at 1.4377. Setbacks should be well supported above 1.2000 on a monthly close basis.GBPUSD – fundamental overview
Short positions in the Pound are being unwound as the Pound trades to a fresh yearly high. The primary driver behind the demand comes from a cooling in tensions on the geopolitical front and around trade wars. Key standouts on Monday’s calendar come from Eurozone trade, Canada housing starts, Canada foreign securities purchases, and Fed speak. US markets are closed for Presidents Day.USDJPY – technical overview
The market is looking to resume the longer-term uptrend after an intense correction in 2024. A higher low is ideally sought out above 140.00 in favor of a bullish continuation. The October monthly close back above 150.00 strengthens the case for longer-term uptrend resumption.USDJPY – fundamental overview
The latest GDP data out of Japan has come out stronger than expected, fueling additional bids for the Yen as it reinforces the BOJ's hawkish stance and likelihood for additional rate hikes. Key standouts on Monday’s calendar come from Eurozone trade, Canada housing starts, Canada foreign securities purchases, and Fed speak. US markets are closed for Presidents Day.AUDUSD – technical overview
There are signs of the potential formation of a longer-term base with the market trading down into a meaningful longer-term support zone. Only a monthly close below 0.6000 would give reason for rethink. A monthly close back above 0.7000 will take the big picture pressure off the downside and strengthen case for a bottom.AUDUSD – fundamental overview
The Australian Dollar continues to extend its recovery on the back of softer US retail sales, diffusion in tension around trade, and the possibility for a peace deal between Russia and the Ukraine. It also seems like most of the downside from what should be a rate cut from the RBA tomorrow has already been priced in. Key standouts on Monday’s calendar come from Eurozone trade, Canada housing starts, Canada foreign securities purchases, and Fed speak. US markets are closed for Presidents Day.USDCAD – technical overview
A sustained hold above 1.3000 over the past several months signals an end to a period of longer-term bearish consolidation and suggests the market is in the process of carving out a more significant longer-term base. Next key resistance now comes in at the 1.5000 psychological barrier. Setbacks should be very well supported ahead of 1.4000.USDCAD – fundamental overview
The addition of another month to the US tariff grace period has given the Canadian Dollar more reason to extend its recovery. Risk sentiment has also turned back up, while the price of oil looks to be stabilizing. Key standouts on Monday’s calendar come from Eurozone trade, Canada housing starts, Canada foreign securities purchases, and Fed speak. US markets are closed for Presidents Day.NZDUSD – technical overview
Overall pressure remains on the downside with the market continuing to stall out on runs up into the 0.6500 area. At the same time, there are some signs of the market wanting to put in a longer-term base. Ultimately, a break back above 0.6500 would be required to take the medium-term pressure off the downside and encourage this prospect. A monthly close below 0.5469 will intensify bearish price action.NZDUSD – fundamental overview
The New Zealand Dollar is generating additional bids on the back of softer US retail sales, diffusion in tension around trade, and the possibility for a peace deal between Russia and the Ukraine. We had already seen the currency bid up last week on higher dairy prices and a jump in business PMIs. Key standouts on Monday’s calendar come from Eurozone trade, Canada housing starts, Canada foreign securities purchases, and Fed speak. US markets are closed for Presidents Day.US SPX 500 – technical overview
The longer term uptrend remains intact and dips continue to be exceptionally well supported. Critical support comes in at 5679, with only a break back below this level to compromise the structure and open the door for a more significant corrective decline. Until then, the focus remains on a continued push to fresh record highs.US SPX 500 – fundamental overview
Investors are feeling better about a soft landing in the US economy. Moreover, there has been a fresh wave of market optimism in anticipation of a market bullish Trump presidency. It will however be important to keep an eye on Trump trade policies, inflation, bigger picture economic data and the latest shift in the Fed dot plot. Any of these variables are capable of easily ruffling some feathers and we've already seen a little of this as 2025 gets going.GOLD (SPOT) – technical overview
The 2019 breakout above the 2016 high at 1375 was a significant development, opening the door for fresh record highs and this next major upside extension into the 3000 area. Setbacks should now be well supported above 2500 on a monthly close basis.GOLD (SPOT) – fundamental overview
The yellow metal has pushed record highs in recent months with solid demand from medium and longer-term accounts. These players are more concerned about inflation, geopolitical risk and a less upbeat global growth outlook. All of this should keep the commodity well supported over the coming months.