


Special report: BOE decision preview
Today’s report: Fed decision well received by investors
The Fed’s base case talk of transitory inflation, and plan to slow the balance sheet runoff were the two major takeaways from the policy decision. Both of these takeaways are what translated to the market’s dovish read, something that was well received by investors.
Wake-up call
- profit taking
- BOE decision
- dovish leaning
- Aussie employment
- tariff risks
- solid GDP
- Trump policies
- Macro themes
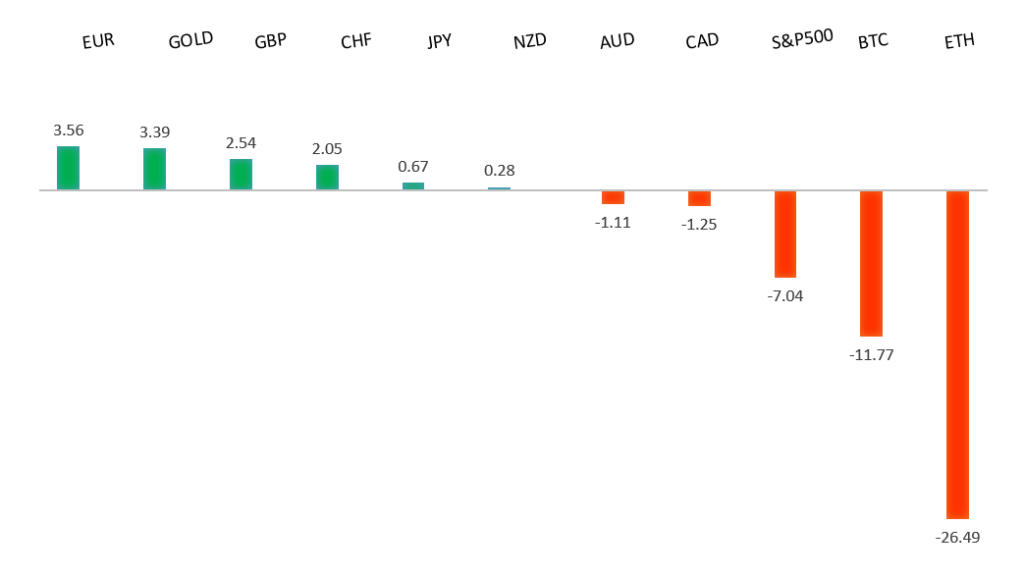
Peformance chart: 30-Day Performance vs. US dollar (%)
Suggested reading
- 10 Value Stocks to Buy for the Long Term, M. Giles, Morningstar (March 18, 2025)
- The Great Reallocation, L. Cousyn, Praetorian Capital (March 17, 2025)
Chart talk: Technical & fundamental highlights
Choose pair:
EURUSD – technical overview
The Euro has been in a multi-month consolidation since bottoming out in 2022. Setbacks have since been exceptionally well supported on dips towards parity, with a higher platform sought out ahead of the next major upside extension. Look for a push back towards the 2023 high at 1.1276 in the days ahead. Only a monthly close below 1.0000 negates.EURUSD – fundamental overview
The Euro has run into profit taking post Fed decision, though ultimately, with the Fed sending a more dovish message, dips should be well supported. Key standouts on Thursday’s calendar come from German producer prices, UK employment, an ECB Lagarde speech, Eurozone construction output, the ECB economic bulletin, an ECB Lane speech, the BOE policy decision, Canada producer prices, a BOE Bailey speech, US initial jobless claims, the Philly Fed, and existing home sales.EURUSD - Technical charts in detail
GBPUSD – technical overview
Signs have emerged of the market wanting to put in a longer-term base after collapsing to a record low in September 2022. The door is now open for the next major upside extension towards the 2018 high at 1.4377. Setbacks should be well supported above 1.2000 on a monthly close basis.GBPUSD – fundamental overview
All of the focus shifts to today's BOE decision where the central bank is expected to remain on hold. The market will be paying particular attention to the vote split, with many suggesting a low probability for a unanimous vote. Key standouts on Thursday’s calendar come from German producer prices, UK employment, an ECB Lagarde speech, Eurozone construction output, the ECB economic bulletin, an ECB Lane speech, the BOE policy decision, Canada producer prices, a BOE Bailey speech, US initial jobless claims, the Philly Fed, and existing home sales.USDJPY – technical overview
There are signs of a meaningful top in place after the market put in a multi-year high in 2024. At this point, the door is now open for a deeper setback towards the 140 area.USDJPY – fundamental overview
The Yen has been rallying back in the aftermath of a Fed decision which revealed the Fed would be looking to reduce its balance sheet runoff. This has the market pricing a more dovish Fed, while getting back to focusing on a hawkish BOJ. Key standouts on Thursday’s calendar come from German producer prices, UK employment, an ECB Lagarde speech, Eurozone construction output, the ECB economic bulletin, an ECB Lane speech, the BOE policy decision, Canada producer prices, a BOE Bailey speech, US initial jobless claims, the Philly Fed, and existing home sales.AUDUSD – technical overview
There are signs of the potential formation of a longer-term base with the market trading down into a meaningful longer-term support zone. Only a monthly close below 0.6000 would give reason for rethink. A monthly close back above 0.7000 will take the big picture pressure off the downside and strengthen case for a bottom.AUDUSD – fundamental overview
The Australian Dollar has come under pressure today after taking in a weaker batch of Aussie employment data. Key standouts on Thursday’s calendar come from German producer prices, UK employment, an ECB Lagarde speech, Eurozone construction output, the ECB economic bulletin, an ECB Lane speech, the BOE policy decision, Canada producer prices, a BOE Bailey speech, US initial jobless claims, the Philly Fed, and existing home sales.USDCAD – technical overview
A sustained hold above 1.3000 over the past several months signals an end to a period of longer-term bearish consolidation and suggests the market is in the process of carving out a more significant longer-term base. Next key resistance now comes in at the 1.5000 psychological barrier. Setbacks should be very well supported ahead of 1.4000.USDCAD – fundamental overview
The Canadian Dollar is back to worrying about risks associated with tariffs in the aftermath of the FOMC decision which addressed these risks. Key standouts on Thursday’s calendar come from German producer prices, UK employment, an ECB Lagarde speech, Eurozone construction output, the ECB economic bulletin, an ECB Lane speech, the BOE policy decision, Canada producer prices, a BOE Bailey speech, US initial jobless claims, the Philly Fed, and existing home sales.NZDUSD – technical overview
Overall pressure remains on the downside with the market continuing to stall out on runs up into the 0.6500 area. At the same time, there are some signs of the market wanting to put in a longer-term base. Ultimately, a break back above 0.6500 would be required to take the medium-term pressure off the downside and encourage this prospect. A monthly close below 0.5469 will intensify bearish price action.NZDUSD – fundamental overview
The New Zealand Dollar is falling in sympathy with its Aussie cousin despite a better than expected New Zealand GDP print. Key standouts on Thursday’s calendar come from German producer prices, UK employment, an ECB Lagarde speech, Eurozone construction output, the ECB economic bulletin, an ECB Lane speech, the BOE policy decision, Canada producer prices, a BOE Bailey speech, US initial jobless claims, the Philly Fed, and existing home sales.US SPX 500 – technical overview
The longer term uptrend remains intact and dips continue to be exceptionally well supported. Critical support comes in at 5386, with only a weekly close back below this level to compromise the structure. Until then, the focus remains on the formation of the next major higher low.US SPX 500 – fundamental overview
Going forward, it will be important to keep an eye on Trump trade policies, inflation, bigger picture economic data and the Fed policy outlook. Any of these variables are capable of easily ruffling some feathers and we've already seen a little of this as 2025 gets going.GOLD (SPOT) – technical overview
The 2019 breakout above the 2016 high at 1375 was a significant development, opening the door for fresh record highs and this next major upside extension towards 3100. Setbacks should now be well supported above 2500 on a monthly close basis.GOLD (SPOT) – fundamental overview
The yellow metal has pushed record highs in recent months with solid demand from medium and longer-term accounts. These players are more concerned about inflation, geopolitical risk and a less upbeat global growth outlook. All of this should keep the commodity well supported over the coming months.