


Next 24 hours: Markets Hold Steady as Traders Brace for Trump Tariff Reveal
Today’s report: Pins and needles ahead of tariff deadline
Financial markets have settled into a wait-and-see ahead of tomorrow’s highly anticipated update on the details of US tariffs. We have seen some position squaring ahead of the event risk, as some traders look to reduce risk associated with worst case scenarios.
Wake-up call
- risk assets
- Positive seasonality
- Unemployment, Tankan
- RBA holds
- Energy surge
- tariff update
- Trump policies
- Macro themes
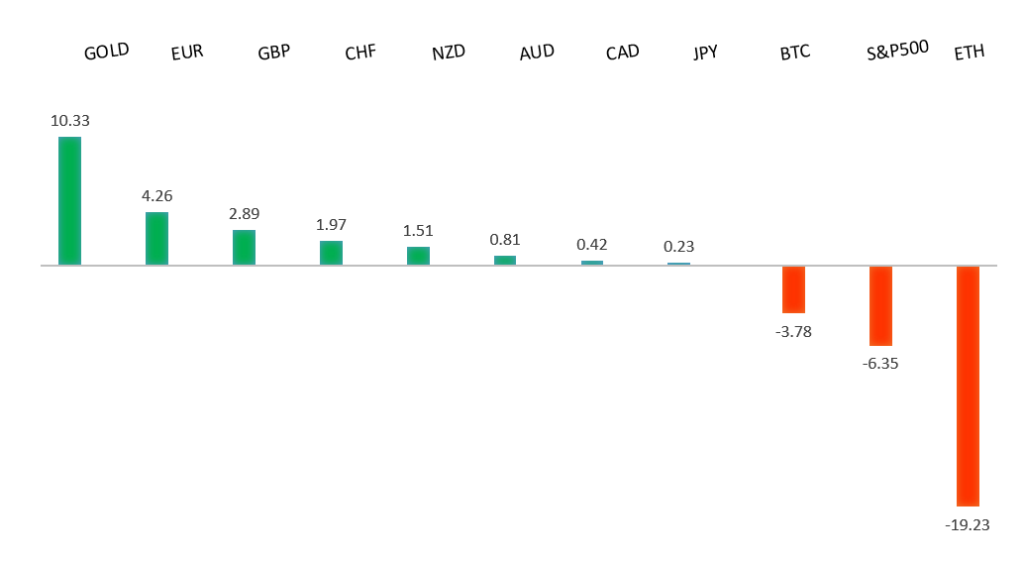
Peformance chart: 30-Day Performance vs. US dollar (%)
Suggested reading
- GameStop Venturing Into Crypto Is a Very Wild Bet, C. Gasparino, NY Post (March 29, 2025)
- The Word Every Investor Should Memorize To Soar In 2025, E. Fry, InvestorPlace (March 29, 2025)
Chart talk: Technical & fundamental highlights
Choose pair:
EURUSD – technical overview
The Euro has been in a multi-month consolidation since bottoming out in 2022. Setbacks have since been exceptionally well supported on dips towards parity, with a higher platform sought out ahead of the next major upside extension. Look for a push back towards the 2023 high at 1.1276 in the days ahead. Only a monthly close below 1.0000 negates.EURUSD – fundamental overview
There were no major updates out of the Eurozone on Monday, though we did see some bids into the Euro on the back of a recovery in risk assets. Key standouts on Tuesday’s calendar come from UK nationwide house prices, German, Eurozone, and UK manufacturing PMIs, Eurozone inflation, Eurozone unemployment, an ECB Lagarde speech, US ISM manufacturing, US JOLTs job openings, and the New Zealand GDT auction.EURUSD - Technical charts in detail
GBPUSD – technical overview
Signs have emerged of the market wanting to put in a longer-term base after collapsing to a record low in September 2022. The door is now open for the next major upside extension towards the 2018 high at 1.4377. Setbacks should be well supported above 1.2000 on a monthly close basis.GBPUSD – fundamental overview
Talk of positive seasonality in April is inviting a fresh wave of demand for the Pound as the new month gets going. Key standouts on Tuesday’s calendar come from UK nationwide house prices, German, Eurozone, and UK manufacturing PMIs, Eurozone inflation, Eurozone unemployment, an ECB Lagarde speech, US ISM manufacturing, US JOLTs job openings, and the New Zealand GDT auction.USDJPY – technical overview
There are signs of a meaningful top in place after the market put in a multi-year high in 2024. At this point, the door is now open for a deeper setback towards the 140 area.USDJPY – fundamental overview
Today's round of economic data out of Japan including unemployment and the Tankan have come in solid on the whole and continue to support the case for more rate hikes from the BOJ. Key standouts on Tuesday’s calendar come from UK nationwide house prices, German, Eurozone, and UK manufacturing PMIs, Eurozone inflation, Eurozone unemployment, an ECB Lagarde speech, US ISM manufacturing, US JOLTs job openings, and the New Zealand GDT auction.AUDUSD – technical overview
There are signs of the potential formation of a longer-term base with the market trading down into a meaningful longer-term support zone. Only a monthly close below 0.6000 would give reason for rethink. A monthly close back above 0.7000 will take the big picture pressure off the downside and strengthen case for a bottom.AUDUSD – fundamental overview
Earlier today, the RBA was out leaving rates on hold as widely expected, while offering up no material change to the tone of the overall communication. On net, the central bank is keeping policy restrictive while continuing to assess the evolving data and other risks. Key standouts on Tuesday’s calendar come from UK nationwide house prices, German, Eurozone, and UK manufacturing PMIs, Eurozone inflation, Eurozone unemployment, an ECB Lagarde speech, US ISM manufacturing, US JOLTs job openings, and the New Zealand GDT auction.USDCAD – technical overview
A sustained hold above 1.3000 over the past several months signals an end to a period of longer-term bearish consolidation and suggests the market is in the process of carving out a more significant longer-term base. Next key resistance now comes in at the 1.5000 psychological barrier. Setbacks should be very well supported ahead of 1.4000.USDCAD – fundamental overview
The dual threat of recession fears and tariffs has been enough to keep the Canadian Dollar weighed down despite the latest jump in energy prices. Key standouts on Tuesday’s calendar come from UK nationwide house prices, German, Eurozone, and UK manufacturing PMIs, Eurozone inflation, Eurozone unemployment, an ECB Lagarde speech, US ISM manufacturing, US JOLTs job openings, and the New Zealand GDT auction.NZDUSD – technical overview
Overall pressure remains on the downside with the market continuing to stall out on runs up into the 0.6500 area. At the same time, there are some signs of the market wanting to put in a longer-term base. Ultimately, a break back above 0.6500 would be required to take the medium-term pressure off the downside and encourage this prospect. A monthly close below 0.5469 will intensify bearish price action.NZDUSD – fundamental overview
The New Zealand Dollar continues to trade with a heavy tone as it awaits the details around tomorrow's US tariffs. Key standouts on Tuesday’s calendar come from UK nationwide house prices, German, Eurozone, and UK manufacturing PMIs, Eurozone inflation, Eurozone unemployment, an ECB Lagarde speech, US ISM manufacturing, US JOLTs job openings, and the New Zealand GDT auction.US SPX 500 – technical overview
The longer term uptrend remains intact and dips continue to be exceptionally well supported. But we are in the throes of a meaningful correction with scope for the pullback to extend back towards major previous resistance turned support in the form of the 2022 high at 4820.US SPX 500 – fundamental overview
Going forward, it will be important to keep an eye on Trump trade policies, inflation, bigger picture economic data and the Fed policy outlook. Any of these variables are capable of easily ruffling some feathers and we've already seen a little of this as 2025 gets going.GOLD (SPOT) – technical overview
The 2019 breakout above the 2016 high at 1375 was a significant development, opening the door for fresh record highs and this next major upside extension towards 3500. Setbacks should now be well supported above 2800 on a monthly close basis.GOLD (SPOT) – fundamental overview
The yellow metal has pushed record highs in recent months with solid demand from medium and longer-term accounts. These players are more concerned about inflation, geopolitical risk and a less upbeat global growth outlook. All of this should keep the commodity well supported over the coming months.