


Next 24 hours: US Dollar Index at lowest levels in three months
Today’s report: Hawkish Fed speak still going strong
A wave of hawkish Fed comments cast some doubts on the market repricing of rate expectations in the aftermath of last week’s softer US inflation print. We had warned about such a prospect, though at this stage, the moves back into the US Dollar and selling of US equities have been mild.
Wake-up call
- Stacked calendar
- OBR warns
- BOJ Kuroda
- RBA Minutes
- growth forecasts
- risk appetite
- Inflation headache
- Dealers report
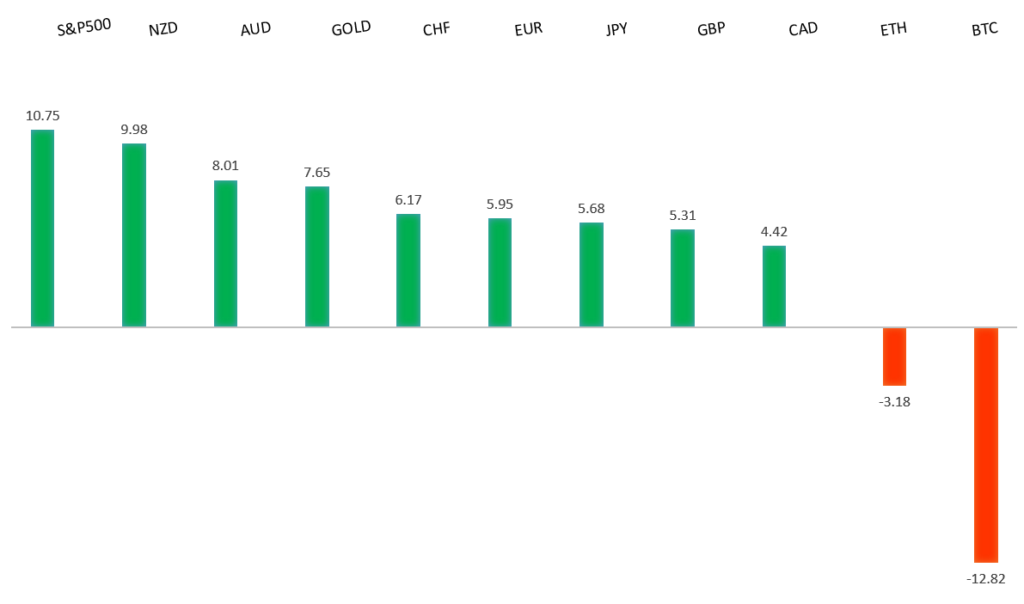
Peformance chart: 30 Day Performance vs. US dollar (%)
Suggested reading
- The FTX Fiasco is Painfully Familiar, M. Gongloff, Bloomberg (November 14, 2022)
- Can Rapid Delivery Apps Get Back on Track?, S. O'Connor, Financial Times (November 14, 2022)
Chart talk: Technical & fundamental highlights
Choose pair:
EURUSD – technical overview
A break back above important resistance at 1.0200 suggests the market could be in the process of carving out a longer-term base after sinking to a multi-year low. Look for any setbacks to now be well supported ahead of 0.9900, with only a break back below 0.9730 to compromise the shifting outlook.EURUSD – fundamental overview
Eurozone industrial production came in much better than expected, helping to keep the single currency propped up on Monday. Key standouts on Tuesday’s calendar come from German wholesale prices, UK employment data, Eurozone trade, Eurozone employment, Eurozone GDP, Eurozone ZEW sentiment, German ZEW sentiment, Canada manufacturing sales, US producer prices, New York Empire State manufacturing, and the New Zealand GDT auction.EURUSD - Technical charts in detail
GBPUSD – technical overview
Signs have emerged of the market wanting to put in a longer-term base after collapsing to a record low in September. The latest weekly close back above the September high at 1.1739 strengthens this prospect. Any setbacks should now be well supported ahead of 1.1100.GBPUSD – fundamental overview
The Pound had a run of underperformance on Tuesday after the OBR warned it would need to borrow GBP100 billion in 2026-27 if austerity not imposed, this compared to what had been a forecast of just GBP31.6 billion in March. Key standouts on Tuesday’s calendar come from German wholesale prices, UK employment data, Eurozone trade, Eurozone employment, Eurozone GDP, Eurozone ZEW sentiment, German ZEW sentiment, Canada manufacturing sales, US producer prices, New York Empire State manufacturing, and the New Zealand GDT auction.USDJPY – technical overview
Longer-term technical studies are in the process of unwinding from severe overbought readings. Look for additional corrective price action back down towards the 130.00 area before the market considers the possibility of uptrend resumption. Rallies should now be well capped ahead of 147.00.USDJPY – fundamental overview
BOJ Kuroda was on the wires saying it was very good the weakening in the Yen had stopped and that a strong Dollar couldn't last forever. But short of this message, there have been no changes to the BOJ's more accommodative outlook, which should continue to invite Yen weakness into any strength. Key standouts on Tuesday’s calendar come from German wholesale prices, UK employment data, Eurozone trade, Eurozone employment, Eurozone GDP, Eurozone ZEW sentiment, German ZEW sentiment, Canada manufacturing sales, US producer prices, New York Empire State manufacturing, and the New Zealand GDT auction.AUDUSD – technical overview
There are signs of the potential formation of a longer-term base following the recent surge back above 0.6500. The latest weekly close back above previous support now turned resistance at 0.6682 strengthens the outlook for a bullish structural shift.AUDUSD – fundamental overview
China stimulus news and solid Tuesday China data have been helping to keep the Australian Dollar propped up. Meanwhile, the RBA Minutes were out earlier today, though there were no surprises to have any impact on market direction. Key standouts on Tuesday’s calendar come from German wholesale prices, UK employment data, Eurozone trade, Eurozone employment, Eurozone GDP, Eurozone ZEW sentiment, German ZEW sentiment, Canada manufacturing sales, US producer prices, New York Empire State manufacturing, and the New Zealand GDT auction.USDCAD – technical overview
A recent surge back above 1.3000 signals an end to a period of bearish consolidation and suggests the market is in the process of carving out a more significant longer-term base. Next key resistance now comes in up into the 1.4000 area. Setbacks should be very well supported down into the 1.3000 area.USDCAD – fundamental overview
The Canadian Dollar cooled off a bit on Monday, this after Ontario was out downgrading growth forecasts. Key standouts on Tuesday’s calendar come from German wholesale prices, UK employment data, Eurozone trade, Eurozone employment, Eurozone GDP, Eurozone ZEW sentiment, German ZEW sentiment, Canada manufacturing sales, US producer prices, New York Empire State manufacturing, and the New Zealand GDT auction.NZDUSD – technical overview
Overall pressure remains on the downside with risk for the current recovery rally to stall out and form a lower top for the next major downside extension. A break back above 0.6162 would be required to take the immediate pressure off the downside.NZDUSD – fundamental overview
The New Zealand Dollar continues to benefit in the aftermath of last week's softer US inflation print and subsequent recovery in risk sentiment. We've since seen added demand from a surge in New Zealand food inflation, and pressure on the RBNZ to hike more aggressively. Key standouts on Tuesday’s calendar come from German wholesale prices, UK employment data, Eurozone trade, Eurozone employment, Eurozone GDP, Eurozone ZEW sentiment, German ZEW sentiment, Canada manufacturing sales, US producer prices, New York Empire State manufacturing, and the New Zealand GDT auction.US SPX 500 – technical overview
Longer-term technical studies are in the process of unwinding from extended readings off record highs. Look for rallies to be well capped in favor of lower tops and lower lows. A monthly close back above 4000 will be required at a minimum to take the immediate pressure off the downside. Next major support comes in around 3200.US SPX 500 – fundamental overview
We've finally reached a point in the cycle where the Fed recognizes unanchored inflation expectations pose a greater downside risk than over-tightening. This is significant, as it means less investor friendly monetary policy that risks potential recession in the months ahead. Overall, we expect inflation to continue to be a problem in Q4 2022 and Q1 2023 that results in downside pressure into rallies.GOLD (SPOT) – technical overview
The 2019 breakout above the 2016 high at 1375 was a significant development, opening the door for fresh record highs. Setbacks should now be well supported above 1600 on a monthly close basis ahead of the next major upside extension. Back above 1808 will strengthen the bullish outlook.GOLD (SPOT) – fundamental overview
The yellow metal continues to be well supported on dips with solid demand from medium and longer-term accounts. These players are more concerned about inflation risk and a less upbeat global growth outlook. All of this should keep the commodity well supported, with many market participants also fleeing to the hard asset as the grand dichotomy of record high equities and record low yields comes to an unnerving climax.