


Next 24 hours: Trading activity to lighten up for US holiday
Today’s report: Investor expectations versus Fed communications
Tuesday’s softer US retail sales data has fueled a round of broad based US Dollar selling, with the market looking for yet another excuse to price more Fed rate cuts than less in 2024.
Wake-up call
- current account
- UK inflation
- USDJPYYield differentials can't be ignored
- Fundamentals
- USDCAD Oil rally does little to inspire Canadian Dollar
- growth concerns
- Fed outlook
- Macro themes
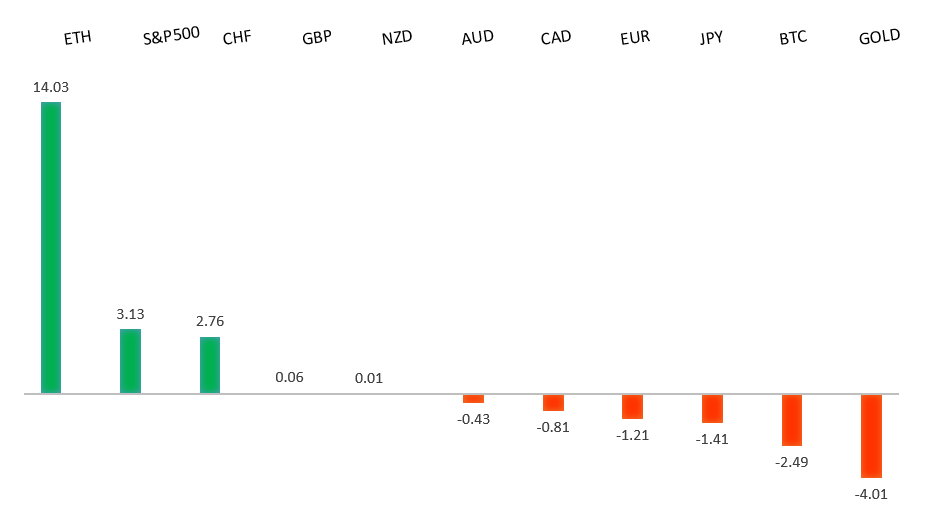
Peformance chart: 30-Day Performance vs. US dollar (%)
Suggested reading
- Britain's market reboot focuses on start-ups and pensions, T. Griggs, FT (June 19, 2024)
- You're Not As Diversified As You Might Believe, J. Calhoun, Alhambra (June 16, 2024)
Chart talk: Technical & fundamental highlights
Choose pair:
EURUSD – technical overview
The Euro has been in a multi-month consolidation since bottoming out in 2022. Setbacks have since been exceptionally well supported on dips below 1.0500, with a higher platform sought out ahead of the next major upside extension. Look for a push through the 2023 high at 1.1276 to strengthen the constructive outlook and extend the recovery run towards 1.2000. Only back below 1.0400 negates.EURUSD – fundamental overview
Although German ZEW reads were a miss on Tuesday, Eurozone ZEW reads were better and Eurozone inflation data came in as expected. This along with the reassurances from Marine LePen have helped to support the Euro overall in recent sessions. Key standouts on Wednesday’s calendar come from UK inflation, the Eurozone current account, US NAHB housing, and the Bank of Canada summary of deliberations.EURUSD - Technical charts in detail
GBPUSD – technical overview
Signs have emerged of the market wanting to put in a longer-term base after collapsing to a record low in September 2022. The door is now open for the next major upside extension towards the 2023 high at 1.3143. Any setbacks should be well supported ahead of 1.2000.GBPUSD – fundamental overview
The Pound has been relatively quiet this week, though we have seen some support as currencies find bids against the US Dollar. Key standouts on Wednesday’s calendar come from UK inflation, the Eurozone current account, US NAHB housing, and the Bank of Canada summary of deliberations.USDJPY – technical overview
The market remains confined to a strong uptrend, most recently extending to a multi-year high through 160.00. Key support comes in at 151.95, with only a weekly close below to delay the constructive outlook.USDJPY – fundamental overview
Indeed, the BOJ Minutes revealed a concern from some members about weakness in the Yen impacting inflation. However, yield differentials remain the name of the game and continue to inspire Yen shorts from carry traders. On the data side, Japan exports grew at a firmer than forecast year over year rate and at the fastest clip since late 2022 Key standouts on Wednesday’s calendar come from UK inflation, the Eurozone current account, US NAHB housing, and the Bank of Canada summary of deliberations.AUDUSD – technical overview
There are signs of the potential formation of a longer-term base with the market trading down into a meaningful longer-term support zone. Only a monthly close below 0.6200 would give reason for rethink. Back above 0.6900 will take the big picture pressure off the downside and strengthen case for a bottom.AUDUSD – fundamental overview
The Australian Dollar has done a good job this week on the back of broad US Dollar selling, an RBA decision which would not rule out additional rate hikes, and record high US equities. Key standouts on Wednesday’s calendar come from UK inflation, the Eurozone current account, US NAHB housing, and the Bank of Canada summary of deliberations.USDCAD – technical overview
Above 1.3000 signals an end to a period of longer-term bearish consolidation and suggests the market is in the process of carving out a more significant longer-term base. Next key resistance now comes in up into the 1.4000 area. Setbacks should be very well supported down into the 1.3000 area.USDCAD – fundamental overview
The Canadian Dollar has suffered overall of late on the back of softer local data and a more dovish leaning Bank of Canada policy outlook. We saw this on Tuesday with the currency unable to muster much momentum despite a strong rally in the price of oil. Key standouts on Wednesday’s calendar come from UK inflation, the Eurozone current account, US NAHB housing, and the Bank of Canada summary of deliberations.NZDUSD – technical overview
Overall pressure remains on the downside with the market continuing to stall out on runs up into the 0.6500 area. At the same time, there are some signs of the market wanting to put in a longer-term base. Ultimately, a break back above 0.6500 would be required to take the medium-term pressure off the downside and encourage this prospect. A monthly close below 0.5800 will intensify bearish price action.NZDUSD – fundamental overview
The New Zealand Dollar has enjoyed some demand on broad based US Dollar selling and record highs in US equities. However, the currency has been lagging its Aussie cousin on a slump in the services sector and consecutive quarters of negative GDP growth, suggesting a recession and increasing the likelihood of a rate cut by the Reserve Bank of New Zealand in November. Key standouts on Wednesday’s calendar come from UK inflation, the Eurozone current account, US NAHB housing, and the Bank of Canada summary of deliberations.US SPX 500 – technical overview
Longer-term technical studies continue to look quite extended, begging for a deeper correction ahead. At the same time, the latest bullish breakout to a fresh record high beyond the 2024 high opens the door for the next measured move upside extension targeting the 5650 area. Key support comes in at 5194.US SPX 500 – fundamental overview
Though we have seen a healthy adjustment of investor expectations towards the amount of rate cuts in 2024, the market still hopes policy will end up erring more towards the investor friendly, accommodative side of things. This bet has kept stocks well bid into dips and consistently pushing record highs. Still, if there is a sense the Fed will need to be more sensitive towards erring on the side of higher rates, it could invite major disruption to the stock market.GOLD (SPOT) – technical overview
The 2019 breakout above the 2016 high at 1375 was a significant development, opening the door for fresh record highs and this next major upside extension into the 2500-3000 area. Setbacks should now be well supported above 2000 on a monthly close basis.GOLD (SPOT) – fundamental overview
The yellow metal has pushed record highs in 2024 with solid demand from medium and longer-term accounts. These players are more concerned about inflation, geopolitical risk and a less upbeat global growth outlook. All of this should keep the commodity well supported, with many market participants also fleeing to the hard asset as the grand dichotomy of record high equities and record low yields comes to an end.