


Today’s report: Investors less threatened by Trump trade policies
The big market driver all week has been President Trump and the latest on trade policies. And as the week has progressed, there has been a trend of the market feeling less and less threatened by the impact of such policies.
Wake-up call
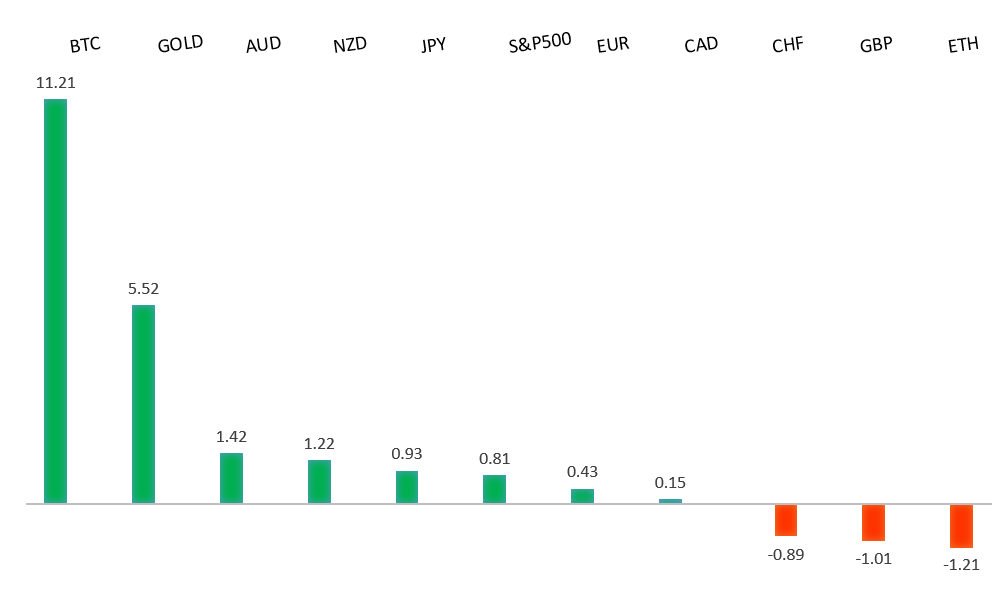
Peformance chart: 30-Day Performance vs. US dollar (%)
Suggested reading
- Pariah Capital: Betting Against Wall Street's Smartest, B. Arends, Marketwatch (January 23, 2025)
- Why Investing is Hard, J. Wiggins, Behavioural Investment (January 22, 2025)
Chart talk: Technical & fundamental highlights
Choose pair:
EURUSD – technical overview
The Euro has been in a multi-month consolidation since bottoming out in 2022. Setbacks have since been exceptionally well supported on dips towards parity, with a higher platform sought out ahead of the next major upside extension. Look for a major bounce in the days ahead and the start to a push back towards the 2023 high at 1.1276. Only a monthly close below 1.0000 negates.EURUSD – fundamental overview
The Euro continues to benefit from softer talk on trade from the Trump administration. The market has now all but fully priced next week's ECB rate cut, leaving room for the Euro to trade higher on the fact. Key standouts on Friday’s calendar come from German, Eurozone, and UK PMI reads, an ECB Lagarde speech, Canada housing data and manufacturing sales, US PMI reads, existing home sales, and Michigan sentiment.EURUSD - Technical charts in detail
GBPUSD – technical overview
Signs have emerged of the market wanting to put in a longer-term base after collapsing to a record low in September 2022. The door is now open for the next major upside extension towards the 2018 high at 1.4377. Setbacks should be well supported above 1.2000 on a monthly close basis.GBPUSD – fundamental overview
A rise in UK manufacturing orders and ongoing profit taking on US Dollar longs is helping to open renewed demand for the Pound. Key standouts on Friday’s calendar come from German, Eurozone, and UK PMI reads, an ECB Lagarde speech, Canada housing data and manufacturing sales, US PMI reads, existing home sales, and Michigan sentiment.USDJPY – technical overview
The market is looking to resume the longer-term uptrend after an intense correction in 2024. A higher low is ideally sought out above 140.00 in favor of a bullish continuation. The October monthly close back above 150.00 strengthens the case for longer-term uptrend resumption.USDJPY – fundamental overview
The Yen has found more room to run after the BOJ went ahead and hiked rates by 25 basis points, the largest hike for the central bank since February 2007. The Yen is also benefiting from broad based US Dollar selling as the market feels less threatened by Trump trade policies. Key standouts on Friday’s calendar come from German, Eurozone, and UK PMI reads, an ECB Lagarde speech, Canada housing data and manufacturing sales, US PMI reads, existing home sales, and Michigan sentiment.AUDUSD – technical overview
There are signs of the potential formation of a longer-term base with the market trading down into a meaningful longer-term support zone. Only a monthly close below 0.6000 would give reason for rethink. A monthly close back above 0.7000 will take the big picture pressure off the downside and strengthen case for a bottom.AUDUSD – fundamental overview
The Australian Dollar is getting a nice boost from the news President Trump would prefer to avoid imposing tariffs on China, instead trying to work out a deal between the two countries. Key standouts on Friday’s calendar come from German, Eurozone, and UK PMI reads, an ECB Lagarde speech, Canada housing data and manufacturing sales, US PMI reads, existing home sales, and Michigan sentiment.USDCAD – technical overview
A sustained hold above 1.3000 over the past several months signals an end to a period of longer-term bearish consolidation and suggests the market is in the process of carving out a more significant longer-term base. Next key resistance now comes in up into the 1.4500-1.5000 area, exposing a retest of the 2020 high just ahead of 1.4700. Setbacks should be very well supported ahead of 1.3500.USDCAD – fundamental overview
Disappointing Canada retail sales and more downside pressure in the price of oil did nothing to increase bearishness towards the Canadian Dollar on Thursday. Instead, we've since seen demand slowly creeping back in presumably as the market believes Trump won't be as aggressive when it comes to tariffs. Key standouts on Friday’s calendar come from German, Eurozone, and UK PMI reads, an ECB Lagarde speech, Canada housing data and manufacturing sales, US PMI reads, existing home sales, and Michigan sentiment.NZDUSD – technical overview
Overall pressure remains on the downside with the market continuing to stall out on runs up into the 0.6500 area. At the same time, there are some signs of the market wanting to put in a longer-term base. Ultimately, a break back above 0.6500 would be required to take the medium-term pressure off the downside and encourage this prospect. A monthly close below 0.5500 will intensify bearish price action.NZDUSD – fundamental overview
The New Zealand Dollar is getting a nice boost from the news President Trump would prefer to avoid imposing tariffs on China, instead trying to work out a deal between the two countries. Key standouts on Friday’s calendar come from German, Eurozone, and UK PMI reads, an ECB Lagarde speech, Canada housing data and manufacturing sales, US PMI reads, existing home sales, and Michigan sentiment.US SPX 500 – technical overview
The longer term uptrend remains intact and dips continue to be exceptionally well supported. Critical support comes in at 5679, with only a break back below this level to compromise the structure and open the door for a more significant corrective decline. Until then, the focus remains on a continued push to fresh record highs.US SPX 500 – fundamental overview
Investors are feeling better about a soft landing in the US economy. Moreover, there has been a fresh wave of market optimism in anticipation of a market bullish Trump presidency. It will however be important to keep an eye on inflation, bigger picture economic data and the latest shift in the Fed dot plot. Any of these variables are capable of easily ruffling some feathers and we've already seen a little of this in the aftermath of the latest Fed decision.GOLD (SPOT) – technical overview
The 2019 breakout above the 2016 high at 1375 was a significant development, opening the door for fresh record highs and this next major upside extension into the 3000 area. Setbacks should now be well supported above 2500 on a monthly close basis.GOLD (SPOT) – fundamental overview
The yellow metal has pushed record highs in recent months with solid demand from medium and longer-term accounts. These players are more concerned about inflation, geopolitical risk and a less upbeat global growth outlook. All of this should keep the commodity well supported over the coming months.