


Next 24 hours: What the market wants....
Today’s report: Market desperate for a Fed pivot
There hasn’t been a whole lot of substance behind this latest wave of broad based US Dollar selling and renewed demand for risk assets. When we break it all down, what it comes down to is a market that is doing whatever it can to will its way into a Fed pivot.
Wake-up call
- impressive IFO
- Sunak
- intervention efforts
- hot inflation
- policy decision
- risk appetite
- Inflation headache
- Dealers report
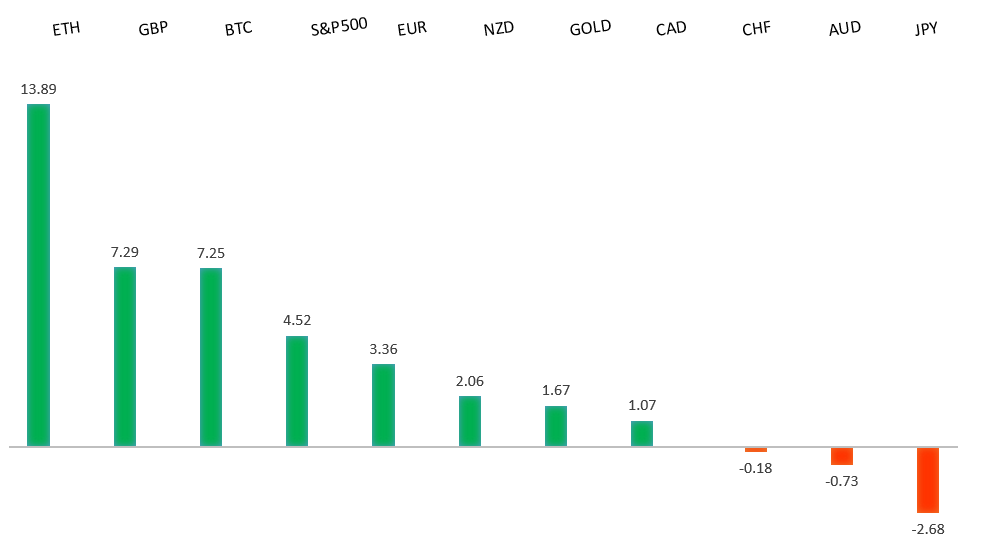
Peformance chart: 30 Day Performance vs. US dollar (%)
Suggested reading
- The Fed’s Cunning Plan to Make You Feel Poorer, J. Authers, Bloomberg (October 26, 2022)
- Can scientists develop a coffee bean more resistant to climate change?, N. Fildes, FT (October 26, 2022)
Chart talk: Technical & fundamental highlights
Choose pair:
EURUSD – technical overview
Technical studies are turning up from oversold territory, suggesting additional setbacks should be limited in favour of some form of a meaningful correction and consolidation. A weekly close back above parity will take the immediate pressure off the downside.EURUSD – fundamental overview
The Euro was boosted on Tuesday from a better round of German IFO data, broad based US Dollar selling, and risk on flow. Key standouts on today’s calendar come from the Bank of Canada policy decision and US new home sales.EURUSD - Technical charts in detail
GBPUSD – technical overview
Signs have emerged of the market wanting to put in a longer-term base after collapsing to a record low in September. A break above the September high at 1.1739 will solidify the recovery. Until then, look for setbacks to be well supported ahead of 1.0800.GBPUSD – fundamental overview
The market clearly sees Sunak with more credibility than the previous administration, as reflected in price action. Meanwhile, broad based US Dollar selling and risk on flow has also inspired demand. Key standouts on today’s calendar come from the Bank of Canada policy decision and US new home sales.USDJPY – technical overview
Technical studies are looking quite stretched on the longer-term chart, warning of consolidation and correction in the days and weeks ahead. Look for additional upside from here to be well capped on rallies above 150.00. Next key support comes in at 145.43.USDJPY – fundamental overview
The big story here has been about this latest second round of intervention from the Japan MOF within one month's time. The Yen rallied sharply after initially declining to fresh multi-year lows. However, already this week, the market is proving just how difficult intervention can be, with the Yen once again back under pressure. Yield differentials and diverging monetary policy are too difficult to ignore. Key standouts on today’s calendar come from the Bank of Canada policy decision and US new home sales.AUDUSD – technical overview
Overall pressure remains on the downside with the market confined to a well defined downtrend. A break back above 0.6682 would be required to take the pressure off the downside. Until then, scope exists for deeper setbacks towards 0.6000.AUDUSD – fundamental overview
The market has been impressed with the Aussie budget update and the latest Aussie inflation data has come in above forecast. This along with broad based US Dollar outflows and renewed risk appetite are helping to drive the Australian Dollar higher. Key standouts on today’s calendar come from the Bank of Canada policy decision and US new home sales.USDCAD – technical overview
A recent surge back above 1.3000 signals an end to a period of bearish consolidation and suggests the market is in the process of carving out a more significant longer-term base. Next key resistance now comes in up into the 1.4000 area. Setbacks should be very well supported down into the 1.3000 area.USDCAD – fundamental overview
The Canadian Dollar has been rallying into today's event risk in the form of the Bank of Canada decision. We've seen broad based US Dollar outflows and renewed risk on trade to help the Loonie. The market is pricing a 75 basis point rate hike from the BoC later today, along with a hawkish communication. Key standouts on today’s calendar come from the Bank of Canada policy decision and US new home sales.NZDUSD – technical overview
Overall pressure remains on the downside with the focus on a retest of the critical low from 2020 at 0.5469. A break back above 0.5814 would be required to take the immediate pressure off the downside.NZDUSD – fundamental overview
The New Zealand Dollar has been finding some demand on the back of broad based US Dollar outflows and renewed risk on flow. On the local front, Deputy PM Robertson said no decision had been made on the minimum wage increase. Key standouts on today’s calendar come from the Bank of Canada policy decision and US new home sales.US SPX 500 – technical overview
Longer-term technical studies are in the process of unwinding from extended readings off record highs. Look for rallies to be well capped in favor of lower tops and lower lows. Back above 4000 will be required at a minimum to take the immediate pressure off the downside. Next major support comes in around 3200.US SPX 500 – fundamental overview
We've finally reached a point in the cycle where the Fed recognizes unanchored inflation expectations pose a greater downside risk than over-tightening. This is significant, as it means less investor friendly monetary policy that risks potential recession in the months ahead. Overall, we expect inflation to continue to be a problem in 2022 that results in downside pressure into rallies.GOLD (SPOT) – technical overview
The 2019 breakout above the 2016 high at 1375 was a significant development, opening the door for fresh record highs. Setbacks should now be well supported above 1600 on a monthly close basis ahead of the next major upside extension.GOLD (SPOT) – fundamental overview
The yellow metal continues to be well supported on dips with solid demand from medium and longer-term accounts. These players are more concerned about inflation risk and a less upbeat global growth outlook. All of this should keep the commodity well supported, with many market participants also fleeing to the hard asset as the grand dichotomy of record high equities and record low yields comes to an unnerving climax.