


Next 24 hours: Traditional markets take back seat to crypto
Today’s report: Mild repricing of rate cut bets on hawkish Fed speak
We suspect market activity will pick up today after a rather subdued Monday session that was lacking in first-tier economic data releases. A round of hawkish Fed comments has however resulted in some mild renewed demand for the Buck.
Wake-up call
- producer prices
- BOE Bailey
- renewed demand
- RBA Minutes
- inflation data
- dovish tweak
- US CPI
- Macro themes
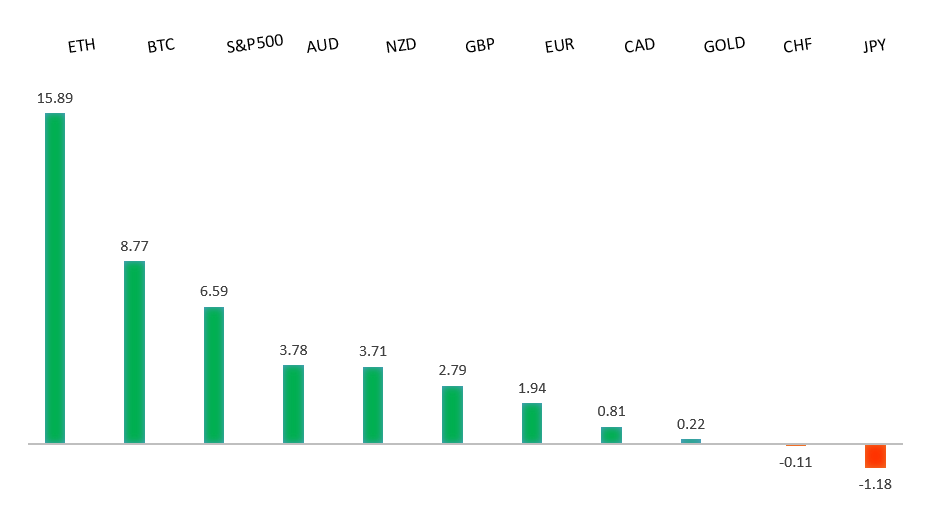
Peformance chart: 30-Day Performance vs. US dollar (%)
Suggested reading
- Four Surprising Economic Charts, B. Carlson, AWOCS (May 19, 2024)
- How Companies Dodge Tariffs, B. Warner, Deal Book (May 19, 2024)
Chart talk: Technical & fundamental highlights
Choose pair:
EURUSD – technical overview
The Euro has been in a multi-month consolidation since bottoming out in 2022. Setbacks have since been exceptionally well supported on dips below 1.0500, with a higher platform sought out ahead of the next major upside extension. Look for a push through the 2023 high at 1.1276 to strengthen the constructive outlook and extend the recovery run towards 1.2000. Only back below 1.0400 negates.EURUSD – fundamental overview
We're coming out of a quiet partial holiday session in Europe which was reflected in mostly subdued Monday price action. Activity is expected to pick up today with a busier calendar and more central bank speak. Key standouts on Tuesday’s calendar come from German producer prices, the Eurozone current account, Eurozone trade, Eurozone construction output, UK CBI trends, Canada inflation, BOE speak, and a batch of Fed speak.EURUSD - Technical charts in detail
GBPUSD – technical overview
Signs have emerged of the market wanting to put in a longer-term base after collapsing to a record low in September 2022. The latest push to a fresh 2024 high beyond 1.2830 confirms the outlook and opens the door for the next major upside extension towards the 2023 high at 1.3143. Any setbacks should now be well supported ahead of 1.2000.GBPUSD – fundamental overview
There is an expectation of further cooling in UK inflation data as a result of lower regulated energy prices. If confirmed, this could move up the BOE's rate cut timeline and open some selling in the Pound. But we will need to wait until tomorrow when we get UK inflation data. There may however be some movement today when BOE Governor Bailey takes to the podium later in the day. Key standouts on Tuesday’s calendar come from German producer prices, the Eurozone current account, Eurozone trade, Eurozone construction output, UK CBI trends, Canada inflation, BOE speak, and a batch of Fed speak.USDJPY – technical overview
The market remains confined to a strong uptrend, most recently extending to a multi-year high through 160.00. Key support comes in at 151.95, with only a weekly close below to delay the constructive outlook.USDJPY – fundamental overview
The absence of from the Ministry of Finance and Bank of Japan has made it easy for Japanese importers and carry traders to be picking up USDJPY into dips. The new line in the sand is now believed to be at the 160.00 barrier. Key standouts on Tuesday’s calendar come from German producer prices, the Eurozone current account, Eurozone trade, Eurozone construction output, UK CBI trends, Canada inflation, BOE speak, and a batch of Fed speak.AUDUSD – technical overview
There are signs of the potential formation of a longer-term base with the market trading down into a meaningful longer-term support zone. Only a monthly close below 0.6200 would give reason for rethink. Back above 0.6900 will take the big picture pressure off the downside and strengthen case for a bottom.AUDUSD – fundamental overview
The Australian Dollar has come under some pressure on Tuesday after the RBA Minutes revealed the central bank considered a hike but thought it was appropriate to leaves rates on hold. We've also seen some added selling after the weaker Aussie consumer confidence report. Key standouts on Tuesday’s calendar come from German producer prices, the Eurozone current account, Eurozone trade, Eurozone construction output, UK CBI trends, Canada inflation, BOE speak, and a batch of Fed speak.USDCAD – technical overview
Above 1.3000 signals an end to a period of longer-term bearish consolidation and suggests the market is in the process of carving out a more significant longer-term base. Next key resistance now comes in up into the 1.4000 area. Setbacks should be very well supported down into the 1.3000 area.USDCAD – fundamental overview
Absence of first tier data out of Canada on Monday left the Canadian Dollar focusing on some weakness in the price of oil, which ended up weighing on the currency. Key standouts on Tuesday’s calendar come from German producer prices, the Eurozone current account, Eurozone trade, Eurozone construction output, UK CBI trends, Canada inflation, BOE speak, and a batch of Fed speak.NZDUSD – technical overview
Overall pressure remains on the downside with the market continuing to stall out on runs up into the 0.6500 area. At the same time, there are some signs of the market wanting to put in a longer-term base. Ultimately, a break back above 0.6500 would be required to take the medium-term pressure off the downside and encourage this prospect. A monthly close below 0.5800 will intensify bearish price action.NZDUSD – fundamental overview
The latest RBNZ poll shows two-year-ahead inflation down to 3% from 3.2%, which could add pressure on the central bank to lean more dovish with its Wednesday communication. The expectation is the RBNZ will leave rates unchanged when it meets tomorrow. This will leave New Zealand holding the position as the country with the highest interest rate amongst the developed nations. Key standouts on Tuesday’s calendar come from German producer prices, the Eurozone current account, Eurozone trade, Eurozone construction output, UK CBI trends, Canada inflation, BOE speak, and a batch of Fed speak.US SPX 500 – technical overview
Longer-term technical studies continue to look quite extended, begging for a deeper correction ahead. At the same time, the latest bullish breakout to a fresh record high beyond the 2024 high opens the door for the next measured move upside extension targeting the 5650 area. Key support comes in at 4928.US SPX 500 – fundamental overview
Though we have seen a healthy adjustment of investor expectations towards the amount of rate cuts in 2024, the market still hopes policy will end up erring more towards the investor friendly, accommodative side of things. This bet has kept stocks well bid into dips and consistently pushing record highs.GOLD (SPOT) – technical overview
The 2019 breakout above the 2016 high at 1375 was a significant development, opening the door for fresh record highs and this next major upside extension into the 2500-3000 area. Setbacks should now be well supported above 2000 on a monthly close basis.GOLD (SPOT) – fundamental overview
The yellow metal has pushed record highs in 2024 with solid demand from medium and longer-term accounts. These players are more concerned about inflation, geopolitical risk and a less upbeat global growth outlook. All of this should keep the commodity well supported, with many market participants also fleeing to the hard asset as the grand dichotomy of record high equities and record low yields comes to an end.