


Next 24 hours: Price action long overdue
Today’s report: Picking up where we left off
2021 has kicked off where we left off as 2020 closed out, with the US Dollar under pressure, stocks at record highs and bitcoin through the roof. The market hasn’t paid any attention to today’s negative risk headlines, instead choosing to focus on familiar upbeat themes.
Wake-up call
- manufacturing PMIs
- Lockdown restrictions
- PM Suga
- SNB policy
- China news
- Oil bid
- USD outflows
- Stocks vulnerable
- Dealers report
- Bigger money
- defi bubble
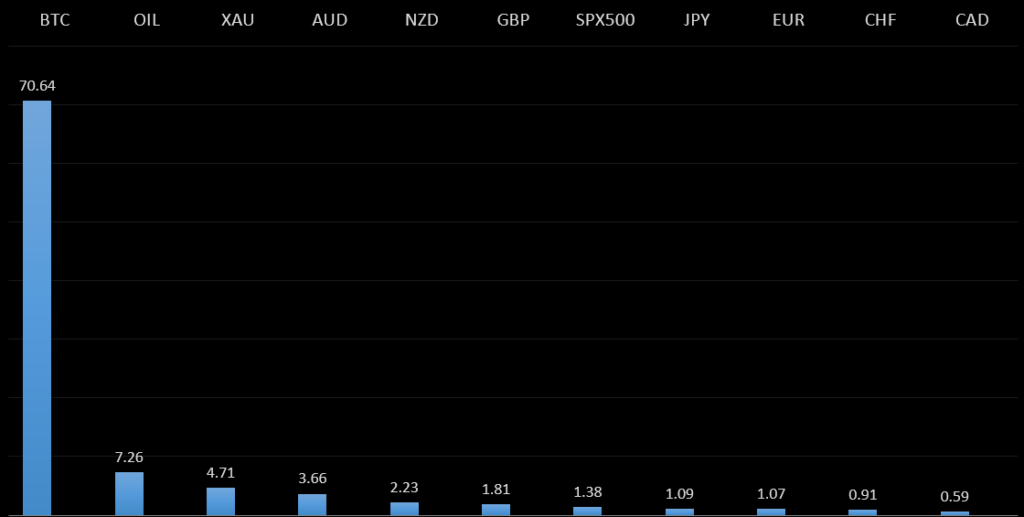
Peformance chart: 30 Day Performance vs. US dollar (%)
Suggested reading
- Bitcoin and SPACs Give 2021 an Early Retro Flavor, J. Authers, Bloomberg (January 4, 2021)
- Joe Biden's Biggest Domestic Challenges, K. Stacey, Financial Times (January 4, 2021)
Chart talk: Technical & fundamental highlights
Choose pair:
EURUSD – technical overview
The recent breakout above 1.2000 ends a period of multi-week consolidation, with the major pair pushing to its highest level since April 2018. The break also opens the door for an eventual retest of the 2018 high up in the 1.2550 area. At this stage, any setbacks should be very well supported above the previous range low around 1.1600.EURUSD – fundamental overview
The Euro comes into 2021 in demand on the back of broad based US Dollar outflow. Liquidity conditions into Monday are quite thin and it will take some more sessions before activity gets back to fuller form. Key standouts on today’s calendar come in the form of German and Eurozone manufacturing PMIs, US manufacturing PMIs, and US construction spending.EURUSD - Technical charts in detail
GBPUSD – technical overview
The recent breakout through the 2019 high at 1.3515 is significant and now sets the stage for the next major upside extension back towards 1.4000. Technical studies are running a little stretched on the daily chart and as such, there is room for some setbacks before the market starts to make its way higher. But look for setbacks to now be very well supported ahead of 1.3000.GBPUSD – fundamental overview
The Pound is well in demand into 2021 on the back of broad based US Dollar weakness and the Brexit deal. At this early stage, there hasn't been much downside pressure associated with the news that lockdown restrictions will be intensifying in the UK. UK ministers are reportedly preparing the details of a Gbp 100 million package to rebuild Britain's fishing fleet, enabling it to take on new quotas as they are relinquished by the EU. Key standouts on today’s calendar come in the form of UK manufacturing PMIs, US manufacturing PMIs, and US construction spending.USDJPY – technical overview
The latest breakdown below 104.00 opens the door for a deeper round of setbacks. Initial support comes in just ahead of 101.00, in the form of the 2020 low, which guards against the major psychological barrier at 100.00 and the 2016 low around 99.00. At this point, it would take a clear break back above 106.00 to take the immediate pressure off the downside.USDJPY – fundamental overview
The Yen continues to find demand on the back of broad based US Dollar outflows and worry around the coronavirus. PM Suga said that he's considering imposing another state of emergency for Tokyo and surrounding prefectures as a result of the "extremely severe" coronavirus situation, and that the government will finalize the extent of the emergency declaration shortly. Key standouts on today’s calendar come in the form of US manufacturing PMIs, and US construction spending.EURCHF – technical overview
Lots of sideways price action here, with no clear directional insight. For the most part, price action has been confined between 1.0600 and 1.0900, and it will take a clear break above or below for an indication of the next big move.EURCHF – fundamental overview
The SNB remains uncomfortable with Franc appreciation and continues to remind the market it will need to be careful about any attempts at trying to force an appreciation in the currency. But the SNB will also need to be careful right now, as its strategy to weaken the Franc is facing headwinds from a less certain global outlook. Any signs of renewed risk liquidation will likely invite a very large wave of demand for the Franc that will put the SNB in the more challenging position of needing to back up its talk with action, that ultimately, may not prove to be as effective as it once was, given where we're at in the monetary policy cycle.AUDUSD – technical overview
Technical studies have turned up in recent months, after the market traded down to its lowest levels since 2003 in 2020. There is evidence of a longer-term bottom following the latest push back through 0.7000, though at this stage, there is risk for a pullback to allow for shorter term studies to unwind. Next big resistance comes in at 0.8000. Setbacks should now be well supported ahead of 0.6800.AUDUSD – fundamental overview
Concerns around softer China manufacturing PMI data and news of more China companies being delisted in the US, haven't been much of a bother to the Australian Dollar, which continues to benefit from broad based US Dollar outflows. Key standouts on today’s calendar come in the form of US manufacturing PMIs, and US construction spending.USDCAD – technical overview
Has been in the process of correcting since topping out earlier this year above 1.4600. At this stage, with the correction well extended, the market is likely to find solid support into the 1.2500 area ahead of a resumption of gains. Ultimately, only a weekly close below 1.2500 would suggest otherwise.USDCAD – fundamental overview
Most of the latest demand for the Loonie comes from the ongoing broad based selling of the US Dollar and a resurgence in demand for OIL. Key standouts on today’s calendar come in the form of Canada manufacturing PMIs, US manufacturing PMIs, and US construction spending.NZDUSD – technical overview
There's a case to be made for a meaningful bottom, after the market bottomed out in 2020. The recent break back above 0.7000 further strengthens this outlook, with the market back in uptrend mode as per the weekly Ichimoku cloud and focused on pushing back towards longer-term resistance in the 0.7500 area. Any setbacks are expected to be well supported ahead of 0.6500.NZDUSD – fundamental overview
The New Zealand Dollar has been bid up to another multi month high to start the year, mostly on the back of continued broad based US Dollar outflows. Key standouts on today’s calendar come in the form of US manufacturing PMIs, and US construction spending.US SPX 500 – technical overview
Longer-term technical studies are looking quite exhausted and the market is showing signs of wanting to roll over after racing to another record high. Look for rallies to be well capped ahead of 3800, with a break back below 3400 to strengthen the outlook.US SPX 500 – fundamental overview
We're trading just off fresh record highs, and yet, with so little room for additional central bank accommodation, given an already depressed interest rate environment, the prospect for sustainable runs to the topside on easy money policy incentives and government stimulus, should no longer be as enticing to investors. Meanwhile, ongoing worry associated with coronavirus fallout should weigh more heavily on investor sentiment in 2021.GOLD (SPOT) – technical overview
The 2019 breakout above the 2016 high at 1375 was a significant development, opening the door for fresh record highs and an acceleration beyond the next major psychological barrier at 2000. Setbacks should now be well supported above 1700. Longer-term technical studies are however in the process of consolidating, with the market in search of a higher low ahead of a bullish continuation.GOLD (SPOT) – fundamental overview
The yellow metal continues to be well supported on dips with solid demand from medium and longer-term accounts. These players are more concerned about exhausted monetary policy, extended global equities, and coronavirus fallout. All of this should keep the commodity well supported, with many market participants also fleeing to the hard asset as the grand dichotomy of record high equities and record low yields comes to an unnerving climax.BTCUSD – technical overview
The bitcoin uptrend has gone parabolic into 2021, with the market rocketing to fresh record highs into the 35,000 area. At the same time, technical studies are tracking in extreme overbought territory across multiple timeframes, which continues to warn of a period of correction ahead. Look for setbacks to now be well supported into the 18,000-20,000 area.BTCUSD – fundamental overview
The break of 30k has turned heads and talk of the asset still being grossly undervalued has inspired another surge in demand towards 40,000. Overall, ongoing adoption, continued innovation in the space and healthy institutional investor appetite have all contributed to this latest wave of strong demand leading to fresh record highs in 2020. Market participants are also attracted to the asset as it proves to be an attractive store of value asset at a time when governments and central banks are printing money at unprecedented rates.BTCUSD - Technical charts in detail
ETHUSD – technical overview
The market has raced up to its highest levels since January 2018, with the break opening this next major upside extension towards the record high at 1420. At the same time, with daily studies showing overextension, there could be a period of consolidation and correction that sets in before a meaningful bullish continuation. Setbacks should now be well supported into the 600-800 area.ETHUSD – fundamental overview
Bitcoin is getting all of the attention, though it's Ether that outperformed its older cousin in 2020. All of the healthy investor risk appetite in global markets has helped to fuel demand for innovation and the Ethereum blockchain is very much at the centre of this when it comes to cryptocurrencies. At the same time, we would be concerned about a bubble in the defi space, with valuations for these projects soaring to alarming heights. We've also warned that any downturn in global sentiment is likely to have a more significant negative impact on the more risk correlated Ether.