


Today’s report: Risk off flow into Friday
Fears around struggling pension funds in the UK have now spread over into the Eurozone and the market has reacted accordingly as we get another wave of stocks lower, US Dollar higher.
Wake-up call
- Bund market
- Truss resignation
- treasury holdings
- Aussie jobs
- BoC pricing
- against peer
- Inflation headache
- Dealers report
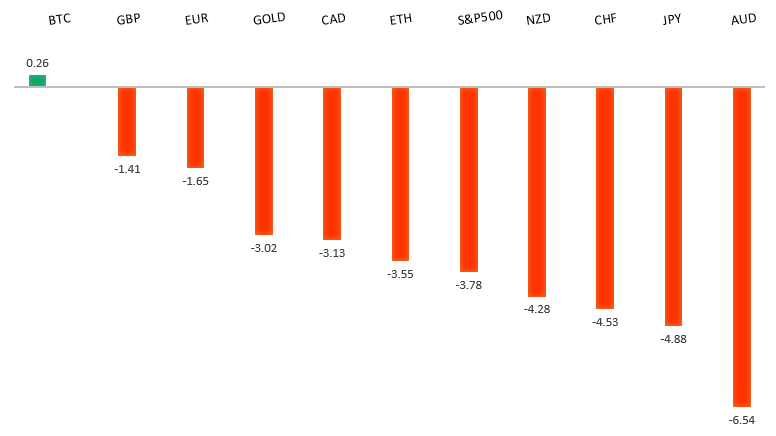
Peformance chart: 30 Day Performance vs. US dollar (%)
Suggested reading
- Time to Believe Japan Is Accepting a Weak Yen, D. Moss, Bloomberg (October 20, 2022)
- American LNG exports are surging with European demand, J. Jacobs, Financial Times (October 20, 2022)
Chart talk: Technical & fundamental highlights
Choose pair:
EURUSD – technical overview
Technical studies are turning up from oversold territory, suggesting additional setbacks should be limited in favour of some form of a meaningful correction and consolidation. A weekly close back above parity will take the immediate pressure off the downside.EURUSD – fundamental overview
The breakdown in the Bund market is now raising concerns around pensions, much like we have seen in the UK. Meanwhile, German producers prices have come in steady. Key standouts on today’s calendar come from UK retail sales, Canada retail sales, Eurozone consumer confidence, and a Fed Williams speech.EURUSD - Technical charts in detail
GBPUSD – technical overview
Signs have emerged of the market wanting to put in a longer-term base after collapsing to a record low in September. A break above the September high at 1.1739 will solidify the recovery. Until then, look for setbacks to be well supported ahead of 1.0800.GBPUSD – fundamental overview
The Pound has held up relatively well in the face of the news around the resignation of Liz Truss. The market had done a good job pricing the event in, which accounts for the lackluster reaction. The UK will get a new PM next Friday, and the new budget is still scheduled for October 31. Key standouts on today’s calendar come from UK retail sales, Canada retail sales, Eurozone consumer confidence, and a Fed Williams speech.USDJPY – technical overview
Technical studies are looking quite stretched on the longer-term chart, warning of consolidation and correction in the days and weeks ahead. Look for additional upside from here to be well capped on rallies above 150.00. Next key support comes in at 148.12.USDJPY – fundamental overview
The Yen has extended declines to fresh multi-year low levels, sinking below pre-intervention levels from September to its lowest levels since 1990. Policy divergence continues to be a big deal here, with yields moving more and more in the US Dollar's favour. Japanese holdings of US Treasuries are now at three-year low, reflecting moves to sell bonds for currency intervention. Key standouts on today’s calendar come from UK retail sales, Canada retail sales, Eurozone consumer confidence, and a Fed Williams speech.AUDUSD – technical overview
Overall pressure remains on the downside with the market confined to a well defined downtrend. A break back above 0.6682 would be required to take the pressure off the downside. Until then, scope exists for deeper setbacks towards 0.6000.AUDUSD – fundamental overview
A weak Aussie jobs report earlier this week, combined with renewed risk off flow have been what have weighed on the Australian Dollar in recent sessions. We did however see some Aussie support on the China quarantine news. Key standouts on today’s calendar come from UK retail sales, Canada retail sales, Eurozone consumer confidence, and a Fed Williams speech.USDCAD – technical overview
A recent surge back above 1.3000 signals an end to a period of bearish consolidation and suggests the market is in the process of carving out a more significant longer-term base. Next key resistance now comes in up into the 1.4000 area. Setbacks should be very well supported down into the 1.3000 area.USDCAD – fundamental overview
Even though traders are betting on a 75 basis point rate hike from the Bank of Canada next week, the Loonie hasn't been able to do much at all this week, trading just off recent yearly and multi-month lows against the US Dollar. Worry around the Canada housing market outlook and the downturn in global sentiment have been driving most of the price action. Key standouts on today’s calendar come from UK retail sales, Canada retail sales, Eurozone consumer confidence, and a Fed Williams speech.NZDUSD – technical overview
Overall pressure remains on the downside with the focus on a retest of the critical low from 2020 at 0.5469. A break back above 0.5814 would be required to take the immediate pressure off the downside.NZDUSD – fundamental overview
The New Zealand Dollar has come back under some pressure on another downturn in sentiment, but has managed to outperform the Australian Dollar after New Zealand inflation readings came in well above forecast earlier this week, fueling speculation the RBNZ would be more hawkish. Key standouts on today’s calendar come from UK retail sales, Canada retail sales, Eurozone consumer confidence, and a Fed Williams speech.US SPX 500 – technical overview
Longer-term technical studies are in the process of unwinding from extended readings off record highs. Look for rallies to be well capped in favor of lower tops and lower lows. Back above 3808 will be required at a minimum to take the immediate pressure off the downside. Next major support comes in around 3200.US SPX 500 – fundamental overview
We've finally reached a point in the cycle where the Fed recognizes unanchored inflation expectations pose a greater downside risk than over-tightening. This is significant, as it means less investor friendly monetary policy that risks potential recession in the months ahead. Overall, we expect inflation to continue to be a problem in 2022 that results in downside pressure into rallies.GOLD (SPOT) – technical overview
The 2019 breakout above the 2016 high at 1375 was a significant development, opening the door for fresh record highs. Setbacks should now be well supported above 1600 on a monthly close basis ahead of the next major upside extension.GOLD (SPOT) – fundamental overview
The yellow metal continues to be well supported on dips with solid demand from medium and longer-term accounts. These players are more concerned about inflation risk and a less upbeat global growth outlook. All of this should keep the commodity well supported, with many market participants also fleeing to the hard asset as the grand dichotomy of record high equities and record low yields comes to an unnerving climax. [audio mp3="https://www.lmax.com/blog/wp-content/uploads/sites/4/2022/10/21octlmaxaudio.mp3"][/audio]