


LMAX Exchange
In part one, we discovered that our multicast receipt thread was being stalled by page faults.
In part two, we’ll dig down into the causes of those page faults, and with some help from our friends at Informatica, get to the bottom of things.
Systems Cavalry Arrives
Let’s focus on just the first stack trace to begin with.
We can have a bit of a guess at what’s going on just by looking at the symbol names. Let’s flip the stack so we can go from out to in:
Java_com_latencybusters_lbm_LBMContext_lbmContextProcessEvents [/opt/lbm/lib/liblbmj.so.5.0.0]
This is the function that the LBM thread repeatedly calls. This is presumably a java wrapper for the native library’s equivalent.
lbm_context_process_events [/opt/lbm/lib/liblbm.so.7.0.1]
The native version of process events
lbm_timer_expire [/opt/lbm/lib/liblbm.so.7.0.1]
Somewhere in LBM, a timer has expired
lbm_rate_ctlr_handle_timer [/opt/lbm/lib/liblbm.so.7.0.1]
Somewhere in LBM‘s rate controller, we’re handling timer expiry?
_dl_runtime_resolve [/lib64/ld-2.12.so]
Which means we need resolve a symbol?
_dl_fixup [/lib64/ld-2.12.so]
Which needs fixing up?
This already feels odd. Why are we resolving a symbol more than fifteen minutes after we started our application? Is there code in LBM that is only triggered for the first time at this point in the performance run?
What we want to know is what happens at
0x7efeba91b7a3 : lbm_rate_ctlr_handle_timer+0x9e3/0xbe0 [/opt/lbm/lib/liblbm.so.7.0.1]
Let’s see if we can work that out.
objdump
The stack trace tells us where to look for a symbol, so we invoke
# objdump -D /opt/lbm/lib/liblbm.so.7.0.1 > ~/lbm-symbols.out
# less ~/lbm-symbols.out
# /lbm_rate_ctlr_handle_timer
000000000015ddc0 <lbm_rate_ctlr_handle_timer>:
  15ddc0:       41 57                   push   %r15
  15ddc2:       41 56                   push   %r14
The stack tells us we are +0x9e3 from the start of that function, which should be at 15ddc0 + 9e3 = 15e7a3
  15e799:       e8 62 af f4 ff          callq  a9700 <pthread_mutex_unlock@plt>
  15e79e:       e8 0d 26 f4 ff          callq  a0db0 <sched_yield@plt>
  15e7a3:       48 8b 7c 24 18          mov    0x18(%rsp),%rdi
  15e7a8:       e8 13 a2 f4 ff          callq  a89c0 <pthread_mutex_lock@plt>
  15e7ad:       e9 ab fc ff ff          jmpq   15e45d <lbm_rate_ctlr_handle_timer+0x69d>
We guess that the mov instruction can’t really be requiring symbol resolution. It seems more likely that the instruction immediately before, to callq a0db0 <sched_yield@plt>, is responsible.
We theorise that LBM is calling sched_yield, and for some reason, it doesn’t already know where sched_yield is. ld is enlisted to find it for us, and that takes a while; perhaps longer than usual because of the memory pressure the system is under.
We’ll take a brief detour to explain how our application is supposed to work out where functions like sched_yield are, then expand our theory based on that.
ELF
No, not Emerson, Lake and Farmer. And yes, before you ask, yes, DWARF and ELF are from the same people.
ELF is a file format used by binaries (and binary libraries).
# file /opt/lbm/lib/liblbm.so.7.0.1
/opt/lbm/lib/liblbm.so.7.0.1: ELF 64-bit LSB shared object, x86-64, version 1 (SYSV), dynamically linked, not stripped
The @plt we see in the output of objdump expands to procedure linkage table. This is a specific section of the ELF format which lists the symbols that were not available at link time; i.e when this library was being built at Informatica. This is sensible we definitely want to have LBM call the currently running OS’s implementation of sched_yield rather than having the build machine’s version statically linked into it.
What happens when we call sched_yield for the first time in liblbm.so.7.0.1, though? Well, it depends who our program interpreter is. We don’t expect liblbm.so.7.0.1 to have an ELF interpreter entry, as it’s a library rather than a binary; our java binary should, though.
# readelf -l /opt/zvm/bin/java

Elf file type is EXEC (Executable file)
Entry point 0x400540
There are 8 program headers, starting at offset 64

Program Headers:
  Type           Offset             VirtAddr           PhysAddr
                 FileSiz            MemSiz              Flags  Align
  PHDR           0x0000000000000040 0x0000000000400040 0x0000000000400040
                 0x00000000000001c0 0x00000000000001c0  R E    8
  INTERP         0x0000000000000200 0x0000000000400200 0x0000000000400200
                 0x000000000000001c 0x000000000000001c  R      1
      [Requesting program interpreter: /lib64/ld-linux-x86-64.so.2]
So, when we load the native LBM library during JNI initialisation, the LBM library .sos will be interpreted by /lib64/ld-linux-x86-64.so.2.
By default, this interpreter lazily initialises references in the plt. Just as malloced memory might only be assigned a physical memory page when we attempt to write to it, the runtime will only resolve (and then cache) a symbol location in the plt at first invocation time.
With this knowledge, we are down to three possibilities.
- This is the very first time
LBMhas invokedsched_yield(possible, but unlikely) - Our dynamic linker is misbehaving (astronomically unlikely)
- Our understanding of how this is supposed to work is incorrect (likely)
There’s only one thing for it: it’s time to write a tiny C program.
#cat call_sched_yield.c
#include <sched.h>

int main(int argc, char* argv[]) {
  sched_yield();
  sched_yield();

  return 0;
}
We compile this program:
gcc call_sched_yield.c
Examine its ELF interpreter:
# readelf -l a.out

Elf file type is EXEC (Executable file)
Entry point 0x4003e0
There are 8 program headers, starting at offset 64

Program Headers:
  Type           Offset             VirtAddr           PhysAddr
                 FileSiz            MemSiz              Flags  Align
  PHDR           0x0000000000000040 0x0000000000400040 0x0000000000400040
                 0x00000000000001c0 0x00000000000001c0  R E    8
  INTERP         0x0000000000000200 0x0000000000400200 0x0000000000400200
                 0x000000000000001c 0x000000000000001c  R      1
      [Requesting program interpreter: /lib64/ld-linux-x86-64.so.2]
and then run it with some special ld environment variables to see if our understanding is correct.
# LD_DEBUG=all ./a.out > ld_debug_one.out 2>&1
# LD_BIND_NOW=y LD_DEBUG=all ./a.out > ld_debug_two.out 2>&1
LD_DEBUG is an instruction to ld-linux to print debugging information about the work the linker is doing. LD_BIND_NOW is an instruction to ld-linux to override the lazy initialisation behaviour and load all symbols in the plt at start time.
# tail -n 15 debug_one.out
     74235:
     74235: initialize program: ./a.out
     74235:
     74235:
     74235: transferring control: ./a.out
     74235:
     74235: symbol=sched_yield;  lookup in file=./a.out [0]
     74235: symbol=sched_yield;  lookup in file=/lib64/libc.so.6 [0]
     74235: binding file ./a.out [0] to /lib64/libc.so.6 [0]: normal symbol `sched_yield' [GLIBC_2.2.5]
     74235:
     74235: calling fini: ./a.out [0]
     74235:
     74235:
     74235: calling fini: /lib64/libc.so.6 [0]
     74235:

# tail -n 11 debug_ld_two.out
     76976: initialize program: ./a.out
     76976:
     76976:
     76976: transferring control: ./a.out
     76976:
     76976:
     76976: calling fini: ./a.out [0]
     76976:
     76976:
     76976: calling fini: /lib64/libc.so.6 [0]
     76976:
‘transferring control’ is the point at which our program’s main is entered. We can see that without LD_BIND_NOW, the first call to sched_yield triggers a lookup. That lookup succeeds and then nothing else happens until the program terminates.
With LD_BIND_NOW=y, however, we see no ld behaviour at all during main.
Our small test program has the same interpreter as java, and behaves exactly as we expect. We should start to consider case 1 (LBM calling sched_yield for the first time) as a more serious contender.
How can we test this? Well, let’s set LD_BIND_NOW=y for the market data service and see what happens.
Result!
In this chart, each block represents a run through the performance environment. The calming blue blocks are NAK free, the yellow blocks saw LBM recovery, and the red blocks experienced a NAK. Guess where we set LD_BIND_NOW=y. 1

Conclusions
- Record all the things. The number of tables in our
perftestschema has grown to seventeen. Only three of those contain the latency distributions we originally set out to measure; much of this investigation was made easier by the data in the others. - Abstractions are great. No way do I want to have to think about this stuff all the time.
- We will sometimes, unfortunately, have to look behind the curtain and figure out what is going on. Linux has phenomenal tooling to help do this, even in cases where you don’t have the source code (although I think we’d have really struggled if the
LBMlibs were stripped). systemtapreally shines in problems of this ilk, where you need to capture a lot of detail about a single event.
Epilogue
We still have a few things to explain. It’s still weird that this is the first time LBM calls sched_yield. What’s triggering that behaviour?
We got an excellent response from Informatica explaining how this might happen:
Looking through the traces and the UM source code, the
sched_yield() in the lbm_rate_ctlr_handle_timer() function will only
occur under very rare circumstances.

The context has to hit the LBTRM or LBTRU rate limit.  On wakeup, the
lbm_rate_ctlr_handle_timer() function attempts to "wakeup" all of the
blocked transports.  The wakeup can fail due to an internal lock being
held.  In that particular case, the lbm_rate_ctlr_handle_timer() will
call sched_yield().
One other thing that the market data service does is publish orderbook snapshots to a market data viewer application. It does this once per second. It turns out that sending all the state of all the orderbooks in our performance environment can occasionally trigger LBM‘s rate limiting.
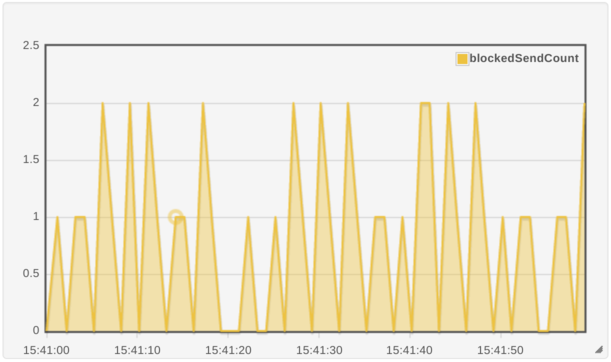
N.B That key records how many times a send call was blocked in a reporting interval so we block one or two writes most seconds.
What we didn’t know was that hitting a rate limit on a publisher could potentially cause jitter on the receive path. Informatica have plans to amend this in future versions, and we can work around it by bringing rate limiting inside our own code.
This also explains some other anomalies we discovered when we analysed when NAKs happened:
- We only ever had one market data service problem per run. This matches exactly with the lazy initialisation of the
plt. - The growth in the depth of the
OrderBookEventssocket buffer always began within 20ms of a second boundary. This matches with the trigger for republishing orderbook snapshots in the market data service (the start of a second), and the rate limiting interval we giveLBM(20ms).
Unanswered questions
We didn’t look into the other stack traces captured by stap. We can reasonably assume they had the same cause, as they disappear with the adoption of LD_BIND_NOW.
We didn’t look too deeply at why symbol resolution is causing a pagefault that proves so difficult to service. Other processes are surely calling sched_yield frequently, so how does looking it up take so long? We might get to this in a future post.
And finally…
We should point out that there was a great deal more trial and error involved in this investigation than this post really communicates.
Much of the monitoring information we used exists only because we were stuck, had a theory about what the problem could be, then added monitoring to confirm or disprove that theory. It took us a lot of those cycles (and a fair few annoyances like perf‘s timestamp behaviour) over a number of months before we had enough information to dive in with system tap.
- This picture was taken a little after we originally turned
LD_BIND_NOWon. The first runs that were free of market data service NAKs showed us that another important application in the environment been suffering packet drops since its host was last rebooted. This was adding more red to theNAKdisplay on the dashboard, but we’d missed the issue because we had grown so used to the red. We fixed the packet loss, disabledLD_BIND_NOWto show how bad things were, then enabled it again to generate the unbroken sequence of calm blue blocks afterward.↩