


Special report: Digesting US inflation data
Today’s report: Stocks just don't care about downside risk
We didn’t get a whole lot of movement in the FX market on Monday, though we did continue to see demand for US equities, which once again, extended their record run.
Wake-up call
- Dovish Lagarde
- Pound uncertain
- Record stocks
- Sydney infections
- Wednesday BoC
- Shadow Board
- Stocks vulnerable
- Dealers report
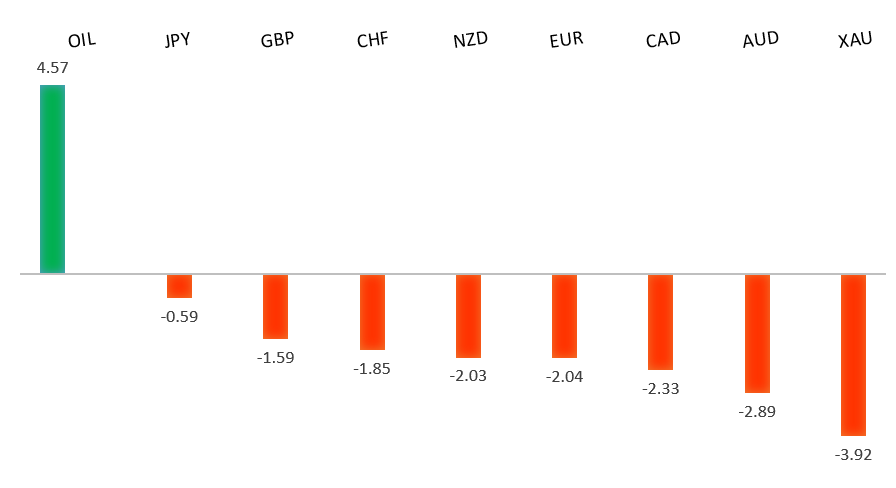
Peformance chart: 30 Day Performance vs. US dollar (%)
Suggested reading
- The China Trade May Be Just Starting to Unravel, J. Authers, Bloomberg (July 12, 2021)
- Growth and Value Trends Are Global, Fisher Investments (July 9, 2021)
Chart talk: Technical & fundamental highlights
Choose pair:
EURUSD – technical overview
The market has been looking for a higher low since topping out in 2021 up at 1.2350. Ideally, this next higher low is sought out ahead of 1.1600 in favour of the next major upside extension back through 1.2350 and towards a retest of the 2018 high at 1.2555 further up.EURUSD – fundamental overview
The Euro came back under pressure on Monday on dovish ECB Lagarde comments. Lagarde said the ECB needed to avoid creating anticipation of near-term exit from current policy, pledging to change policy guidance at the next meeting, while also hinting at fresh support measures. Key standouts on Tuesday’s calendar include German inflation, The BOE Financial Stability report and BOE Minutes, and US inflation reads.EURUSD - Technical charts in detail
GBPUSD – technical overview
Technical studies are in the process of consolidating from stretched levels after the push to fresh multi-month highs. This leaves room for additional consolidation, before the market considers a meaningful bullish continuation towards a retest of the 2018 high. But look for setbacks to now be very well supported into the 1.3500 area.GBPUSD – fundamental overview
The Pound doesn't know what to make of the end of UK virus restrictions on July 19th. On the one side, it's a positive as it sends a message things are back to normal. On the other side, there is concern with cases ticking back up around the globe. The UK Scientific Advisory Group for Emergencies was out predicting an infection surge of 100-200 deaths per day in August. Key standouts on Tuesday’s calendar include German inflation, The BOE Financial Stability report and BOE Minutes, and US inflation reads.USDJPY – technical overview
The longer-term trend is still bearish despite the recent run higher. Look for additional upside to be limited, with scope for a topside failure and bearish resumption over the coming sessions. It would take a clear break back above 113.00 to negate the outlook.USDJPY – fundamental overview
It's been impossible for the Yen to ignore the ongoing bid in record high US equities. As a consequence, we've seen a round of Yen selling kick back into play as the new week gets going. Key standouts on Tuesday’s calendar include German inflation, The BOE Financial Stability report and BOE Minutes, and US inflation reads.AUDUSD – technical overview
Technical studies have turned up in recent months, after the market traded down to its lowest levels since 2003 in 2020. There is evidence of a longer-term bottom following the latest push back through 0.7000, though at this stage, there is risk for a deeper pullback to allow for shorter term studies to unwind. Setbacks should now be well supported ahead of 0.7000.AUDUSD – fundamental overview
The Australian Dollar was up and down in Monday trade but didn't really go anywhere at all. The currency was caught between the demand from a continued record run in US stocks and selling pressure from the uptick in virus infections in Sydney. Key standouts on Tuesday’s calendar include German inflation, The BOE Financial Stability report and BOE Minutes, and US inflation reads.USDCAD – technical overview
Has been in major decline since topping out in 2021 above 1.4600. At this stage, with the decline now well extended, the market is likely to find solid support into the 1.2000 area ahead of a resumption of gains. Ultimately, only a weekly close below 1.2000 would suggest otherwise. A weekly close back above 1.2500 will strengthen the outlook.USDCAD – fundamental overview
CFTC positioning data continues to show overweight long exposure in the Canadian Dollar. But higher US equities and expectations for a more hawkish leaning Bank of Canada decision tomorrow, have kept the Loonie from selling off. Key standouts on Tuesday’s calendar include German inflation, The BOE Financial Stability report and BOE Minutes, and US inflation reads.NZDUSD – technical overview
The market has been very well supported in recent months and there is evidence of a longer-term base. Look for setbacks to hold up above 0.6800, with sights set on a run back towards the 0.7500 area.NZDUSD – fundamental overview
The New Zealand Dollar has been well supported in recent trade on the back of the record run in US equities and calls for a more hawkish RBNZ. The RBNZ Shadow Board was just out saying tightening would be appropriate at this week's meeting. Key standouts on Tuesday’s calendar include German inflation, The BOE Financial Stability report and BOE Minutes, and US inflation reads.US SPX 500 – technical overview
Longer-term technical studies are looking quite exhausted and the market is showing signs of wanting to roll over after racing to another record high. Look for rallies to be well capped ahead of 4500, with a break back below 4139 to strengthen the outlook.US SPX 500 – fundamental overview
We're trading just off fresh record highs, and yet, with so little room for additional central bank accommodation, given an already depressed interest rate environment, the prospect for sustainable runs to the topside on easy money policy incentives and government stimulus, should no longer be as enticing to investors. Meanwhile, ongoing worry associated with coronavirus fallout and risk of rising inflation should weigh more heavily on investor sentiment into the second half of 2021.GOLD (SPOT) – technical overview
The 2019 breakout above the 2016 high at 1375 was a significant development, opening the door for fresh record highs and an acceleration beyond the next major psychological barrier at 2000. Setbacks should now be well supported above 1600.GOLD (SPOT) – fundamental overview
The yellow metal continues to be well supported on dips with solid demand from medium and longer-term accounts. These players are more concerned about exhausted monetary policy, extended global equities, and coronavirus fallout. All of this should keep the commodity well supported, with many market participants also fleeing to the hard asset as the grand dichotomy of record high equities and record low yields comes to an unnerving climax.