


Next 24 hours: Euro sinks to 20 year low
Today’s report: US market returns from holiday break
The week is about to get started for real as the US market returns from the long holiday weekend. Overall, it’s been about risk off and a higher US Dollar, this as the market prices the reality of higher inflation and the less investor friendly impact on monetary policy.
Wake-up call
- EU-Russia tension
- Q3 2023
- safe haven
- thin trade
- Business outlook
- 2023 recession
- Stocks vulnerable
- Dealers report
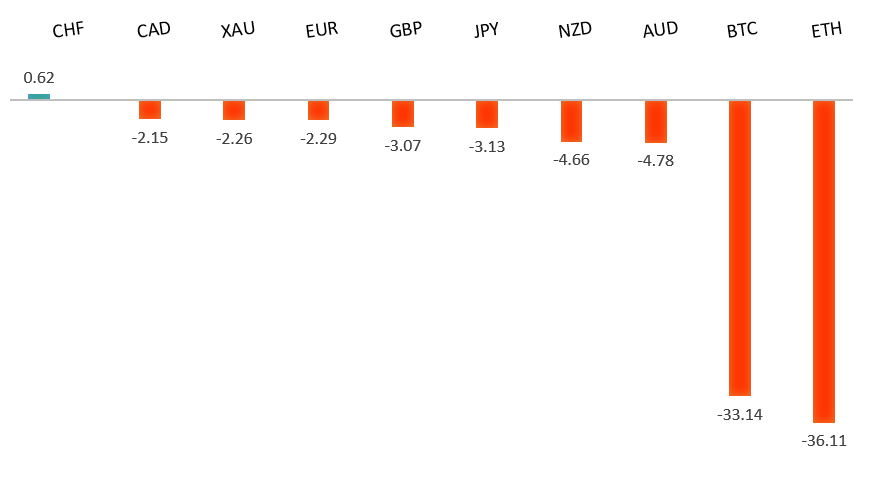
Peformance chart: 30 Day Performance vs. US dollar (%)
Suggested reading
- Cuban Crisis Parallels Give Stocks a 1962 Look, J. Authers, Bloomberg (July 1, 2022)
- Hong Kong's Future as Asia's Financial Centre, T. Kinder, Financial Times (June 30, 2022)
Chart talk: Technical & fundamental highlights
Choose pair:
EURUSD – technical overview
The market has come under intense pressure in recent weeks, with setbacks accelerating to retest the multi-year low from 2017. A clear break below 1.0300 now sets up the next downside extension towards parity. At the same time, technical studies have been in the process of unwinding from oversold. But back above 1.1000 would be required at a minimum to take the immediate pressure off the downside.EURUSD – fundamental overview
The ECB's casual attitude around rocketing inflation has not been a help to the Euro. Last week's Eurozone CPI reads were above forecast and yet, ECB communications continued to talk of gradual policy normalization. Meanwhile, the Euro faces persistent pressure from ongoing concerns over EU-Russia relations on gas flows. Key standouts on Tuesday’s calendar come from Aussie retail sales, the RBA policy decision, German, Eurozone, and UK PMI reads, Canada building permits, and US factory orders.EURUSD - Technical charts in detail
GBPUSD – technical overview
The market continues to be exceptionally well supported on dips down into the 1.2000 area, with the latest setback once again holding up around the barrier. Overall, the daily trend remains bearish, though there are signs of the market wanting to put in a meaningful bottom ahead of the next major upside extension. Look for a clear break back above 1.2700 to strengthen this outlook. A monthly close below 1.2000 would force a rethink of the outlook.GBPUSD – fundamental overview
UK markets are very worried about stagflation risks, especially with the price of UK gas hitting record levels. UK markets have also priced in a rate cut by Q3 2023. All of this has kept the Pound under pressure. Key standouts on Tuesday’s calendar come from Aussie retail sales, the RBA policy decision, German, Eurozone, and UK PMI reads, Canada building permits, and US factory orders.USDJPY – technical overview
The market has rocketed higher to its highest levels since 1998 after breaking through the 2002 high. Technical studies are however looking stretched, with scope for a sizable consolidation and correction in the weeks ahead. Look for additional upside from here to be well capped ahead of 140.00. A break back below 130.00 would take the immediate pressure off the topside.USDJPY – fundamental overview
Finally some mild demand for a very beaten down Yen in recent sessions. Most of the demand reported has been around flight to safety bids. Key standouts on Tuesday’s calendar come from Aussie retail sales, the RBA policy decision, German, Eurozone, and UK PMI reads, Canada building permits, and US factory orders.AUDUSD – technical overview
Overall pressure remains on the downside and conditions remain quite choppy. A break back above 0.7070 would be required at a minimum to take the immediate pressure off the downside. Until then, scope exists for a retest and break of the yearly low.AUDUSD – fundamental overview
The Australian Dollar enjoyed a mini recovery in some very thin Monday holiday trade. Overall however, Aussie hasn't been able to get away from fallout around the downturn in global sentiment, with the currency trading just off a fresh yearly low as a consequence. Key standouts on Tuesday’s calendar come from Aussie retail sales, the RBA policy decision, German, Eurozone, and UK PMI reads, Canada building permits, and US factory orders.USDCAD – technical overview
A recent surge back above 1.3000 signals an end to a period of bearish consolidation and suggests the market is in the process of carving out a more significant longer-term base. Next key resistance now comes in up into the 1.3500 area. Setbacks should be very well supported down into the 1.2500 area.USDCAD – fundamental overview
On Monday, the Bank of Canada's Business Outlook survey showed show short-term inflation expectations were rising, with price pressures expected to persist for longer as Canada faces tight labor markets and companies are hit by rising input costs. This along with higher oil prices helped to open renewed demand for the Canadian Dollar. Key standouts on Tuesday’s calendar come from Aussie retail sales, the RBA policy decision, German, Eurozone, and UK PMI reads, Canada building permits, and US factory orders.NZDUSD – technical overview
Overall pressure remains on the downside and conditions remain quite choppy. A break back above 0.6600 would be required to force a shift in the structure and suggest we are seeing a more significant bullish reversal. Until then, scope exists for fresh yearly lows and a retest of the 2015 low down towards 0.6100.NZDUSD – fundamental overview
The New Zealand Dollar hasn't been able to get away from fallout around the downturn in global sentiment, with the currency sinking to a fresh yearly low as a consequence. In fact, the New Zealand Dollar is at its lowest levels against the Buck since May of 2020. The Bank of New Zealand is forecasting a 2023 recession and says the downturn could be steeper than expected. Key standouts on Tuesday’s calendar come from Aussie retail sales, the RBA policy decision, German, Eurozone, and UK PMI reads, Canada building permits, and US factory orders.US SPX 500 – technical overview
Longer-term technical studies are in the process of unwinding from extended readings off record highs. Look for rallies to be well capped in favor of lower tops and lower lows. Back above 4,206 will be required at a minimum to take the immediate pressure off the downside. Next major support comes in around 3,400.US SPX 500 – fundamental overview
With so little room for additional central bank accommodation, given an already depressed interest rate environment, the prospect for sustainable runs to the topside on easy money policy incentives and government stimulus, should no longer be as enticing to investors. Meanwhile, ongoing worry associated with rising inflation and slower growth should continue to weigh more heavily on investor sentiment in 2022.GOLD (SPOT) – technical overview
The 2019 breakout above the 2016 high at 1375 was a significant development, opening the door for fresh record highs. Setbacks should now be well supported above 1700.GOLD (SPOT) – fundamental overview
The yellow metal continues to be well supported on dips with solid demand from medium and longer-term accounts. These players are more concerned about exhausted monetary policy, extended global equities, and inflation risk. All of this should keep the commodity well supported, with many market participants also fleeing to the hard asset as the grand dichotomy of record high equities and record low yields comes to an unnerving climax.