


LMAX Exchange
We recently fixed a long standing performance issue at LMAX Exchange.
The path we followed to fixing it was sufficiently windy to merit a couple of posts.
In this first post we’ll define our issue and then attempt to figure out its cause.
Problem Identified
At LMAX Exchange we have an application named the market data service. It’s multicast receipt thread is not keeping up it occasionally stalls for around 150ms. This causes data loss; the service has to request retransmission (it NAKs) from upstream. This causes a degradation in system latency, which we want to avoid.
Two quick definitions:
LBM: the technology we use to talk multicast (this is an Informatica product). Under the hood, it uses epoll_wait.
OrderBookEvents: the name of the high volume multicast topic we’re not keeping up with.
Ruling out the obvious suspects
Here are a few things we ruled out early on:
- A burst of traffic
We took packet captures and arrival rate was constant. We took captures on other subscribers to the same data and the arrival rate was constant there, too.
- Preemption of multicast receipt thread
We’ve talked about reducing this sort of jitter here and here.
The code and configuration we use to do multicast receipt is shared across several applications. We’d expect to see this issue everywhere if we’d managed to screw this up, and we don’t. 1
- LMAX code being slow to respond to data passed up from
LBM
The LBM thread calls us back with data from that topic. Helpfully it also records a statistic that captures the maximum callback time for a given interval. It is not big enough to explain the issue.
Worried that the sampling rate of that metric might be hiding an issue, we added our own monitoring to time each individual callback. This also found no evidence of a problem large enough to be responsible.
- Getting blocked in
epoll_waitfor longer than the interval passed to it.
We configured our LBM thread to ‘spin’. We pass it a parameter to instruct it such that its calls to epoll_wait specify a timeout of 0. This tells epoll_wait to return immediately if no events are present. The problem remained.
Let’s zoom out a little.
What’s different about the Market Data Service?
Or, better: why isn’t this happening to any of the other OrderBookEvents subscribers? We have several running in this environment and they behave flawlessly.
Well, it does a lot more disk IO. The other subscribers tend to be gateways. This is LMAX Exchange speak for “translates internal LMAX multicast traffic into different format client sockets”. One example might be a FiX market data application.
The market data service is special; it journals the OrderBookEvents topic to disk, creating a system of record. It maintains another disk based format to support market surveillance. If that weren’t enough, it also manages the recording of various csv files that end up being part of our market data API. We didn’t do a tremendous job of keeping this application simple!
We might think that the root cause is slow disk access, but this cannot be the case. The writes to disk occur either on or downstream of our business logic thread, not the LBM thread. The metrics we capture on the buffer between LBM and those threads show us that we’re easily keeping up.
We’ve ruled out preemption via isolation. We’ve ruled out a bursty network. We’ve ruled out the effect of slow disk writes.
What other shared system resources are there? Are they able to make the market data service behave so much worse than our other applications?
The Linux Memory Subsystem
The programming interface for much of the market data service might well be files, but at runtime, Linux may cache many of those files in memory. A brief google for “Linux Page Cache” will find a variety of introductions to this topic; we won’t go into it here.
A picture might speed us up a little bit here. Here’s a chart of how much system memory is free across a performance run, in kilobytes.
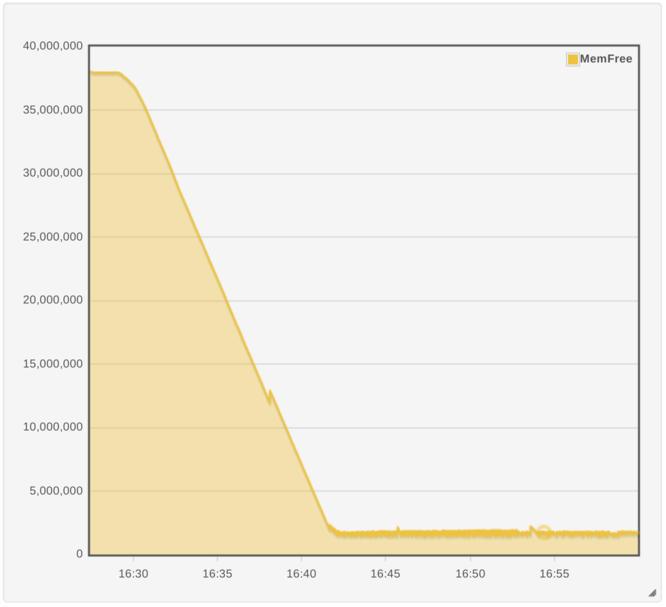
We can see that around fifteen minutes into the run, we’ve eaten up all but 2Gb of the available RAM. The shape of the graph changes into a sawtooth. We’re still eating memory, but the OS periodically frees some by evicting the least recently used files from memory.
If this is our issue, we’d guess that all of our NAKs should be occurring after the system enters that sawtooth area. Indeed, a brief look at the timings in the performance test results database shows this to be the case.
How could this be causing problems on the LBM thread, though? It shouldn’t be touching the file system, so whether a file is cached or not should not impact it. Perhaps it attempts to allocate memory at a really inopportune moment and the page cache has to evict some files back to the disk in order to supply it.
In the parlance of the memory subsystem this is a major page fault. Let’s see if we can capture the page faults occurring on the LBM thread and correlate them with an OrderBookEvents NAK.
Capturing page faults
We want to be able to see every page fault on the LBM thread encounters that takes more than x milliseconds. There’s a few ways to do this; let’s pick one.
- perf
This is, apparently, a one liner.
perf record -e major-faults -ag
This records all major faults system wide we could add more flags to make it process specific.
A couple of things are a bit harder to do at this point:
- how do we work out how long it takes to service a fault?
- how do we correlate the fault timing with our
NAKs?
The second is the real kicker. perf, by default, uses the system uptime as the ‘time’ of an event it records. perf record‘s man page claims that -T also samples epoch timestamps, and that perf report -D can view them. As far as I could work out, the timestamps are buried somewhere in the binary part shown to you in the report.
The pain of having to parse the perf format and rework the timestamps was enough to put me off.
- ftrace
While this has sensible timestamps; how do we measure the duration of a page fault rather than just measuring when they occur?
- systemtap
This is what I ended up using.
Not least because googling “systemtap trace page faults” takes you straight to a working example.
Systemtap
Let’s not go into any detail about how systemtap works. Suffice to say it allows you to execute a section of code at particular points in existing binaries, even those in kernel space.
Here’s the script we found earlier:
#! /usr/bin/env stap

global fault_entry_time, fault_address, fault_access
global time_offset

probe begin { time_offset = gettimeofday_us() }

probe vm.pagefault {
  t = gettimeofday_us()
  fault_entry_time[tid()] = t
  fault_address[tid()] = address
  fault_access[tid()] = write_access ? "w" : "r"
}

probe vm.pagefault.return {
  t=gettimeofday_us()
  if (!(tid() in fault_entry_time)) next
  e = t - fault_entry_time[tid()]
  if (vm_fault_contains(fault_type,VM_FAULT_MINOR)) {
    ftype="minor"
  } else if (vm_fault_contains(fault_type,VM_FAULT_MAJOR)) {
    ftype="major"
  } else {
    next #only want to deal with minor and major page faults
  }

  printf("%d:%d:%id:%s:%s:%dn",
    t - time_offset, tid(), fault_address[tid()], fault_access[tid()], ftype, e)
  #free up memory
  delete fault_entry_time[tid()]
  delete fault_address[tid()]
  delete fault_access[tid()]
}
This script adds two code sections (‘probes’ in systemtap lingo) at the beginning and end of something called vm.pagefault. The interpretation of the probe code is left as an exercise to the reader.
Let’s try to run that script; there’s a small chance it might immediately tell us the answer.
# stap pfaults.stp
WARNING: cannot find module kernel debuginfo: No DWARF information found [man warning::debuginfo]
semantic error: while resolving probe point: identifier 'kernel' at /usr/share/systemtap/tapset/linux/memory.stp:68:8
        source:                      kernel.function("__handle_mm_fault@mm/memory.c").call
                                     ^

semantic error: no match (similar functions: __handle_mm_fault, handle_mm_fault, handle_pte_fault, drm_vm_fault, shm_fault)
semantic error: while resolving probe point: identifier 'kernel' at :67:22
        source: probe vm.pagefault = kernel.function("handle_mm_fault@mm/memory.c").call !,
                                     ^

semantic error: no match (similar functions: handle_mm_fault, __handle_mm_fault, handle_pte_fault, drm_vm_fault, shm_fault)
semantic error: while resolving probe point: identifier 'vm' at pfaults.stp:8:7
        source: probe vm.pagefault {
                      ^

semantic error: no match
Pass 2: analysis failed.  [man error::pass2]
Number of similar error messages suppressed: 3.
Number of similar warning messages suppressed: 3.
Rerun with -v to see them.
If only! This is disheartening, but we’re getting quite used to things that don’t work as we expect by this stage, so let’s look at the error output properly for clues.
Systemtap is telling us two things, both of which are bad news:
WARNING: cannot find module kernel debuginfo: No DWARF information found [man warning::debuginfo]
“I can’t find debug information for the kernel you’re running :-(”
semantic error: while resolving probe point: identifier 'kernel' at /usr/share/systemtap/tapset/linux/memory.stp:68:8
        source:                      kernel.function("__handle_mm_fault@mm/memory.c").call
“I can’t find the place you asked me to probe”
…and one thing which is very, very helpful indeed.
semantic error: no match (similar functions: __handle_mm_fault, handle_mm_fault, handle_pte_fault, drm_vm_fault, shm_fault)
“Did you mean one of these?”
It looks like systemtap is trying to tell us that it doesn’t know what __handle_mm_fault@mm/memory.c is, but it has heard of __handle_mm_fault. Perhaps vm.pagefault might be some sort of alias.
# man stap
STAP(1)

NAME
       stap - systemtap script translator/driver

SYNOPSIS
       stap [ OPTIONS ] FILENAME [ ARGUMENTS ]
       stap [ OPTIONS ] - [ ARGUMENTS ]
       stap [ OPTIONS ] -e SCRIPT [ ARGUMENTS ]
       stap [ OPTIONS ] -l PROBE [ ARGUMENTS ]
       stap [ OPTIONS ] -L PROBE [ ARGUMENTS ]
       stap [ OPTIONS ] --dump-probe-types
       stap [ OPTIONS ] --dump-probe-aliases
       stap [ OPTIONS ] --dump-functions
--dump-probe-aliases, you say?
# stap --dump-probe-aliases | grep pagefault
vm.pagefault = kernel.function("handle_mm_fault@mm/memory.c").call!, kernel.function("__handle_mm_fault@mm/memory.c").call
vm.pagefault.return = kernel.function("handle_mm_fault@mm/memory.c").return!, kernel.function("__handle_mm_fault@mm/memory.c").return
Perhaps we can avoid the alias altogether and just bind probes to kernel.function("handle_mm_fault") and kernel.function("__handle_mm_fault")?
We make the following change:
-probe vm.pagefault {
+probe kernel.function("handle_mm_fault").call!, kernel.function("__handle_mm_fault").call {

-probe vm.pagefault.return {
+probe kernel.function("handle_mm_fault").return!, kernel.function("__handle_mm_fault").return {
…and now we get the following output:
[root@ldperf-pf2-mmmd01 perf]# stap pfaults-dealiased.stp
WARNING: never-assigned local variable 'address' (similar: fault_address, t, fault_access, write_access, time_offset): identifier 'address' at pfaults-dealiased.stp:11:26
 source:   fault_address[tid()] = address
                                  ^
WARNING: never-assigned local variable 'write_access' (similar: fault_access, address, t, fault_address, time_offset): identifier 'write_access' at :12:25
 source:   fault_access[tid()] = write_access ? "w" : "r"
                                 ^
WARNING: never-assigned local variable 'fault_type' (similar: ftype, e, fault_access, t, fault_address): identifier 'fault_type' at :19:25
 source:   if (vm_fault_contains(fault_type,VM_FAULT_MINOR)) {
I confess, I am still confused as to what this means. I also don’t really know what those variables are meant to address in that script; if I look at the kernel source that defines __handle_mm_fault for our kernel version, there are no parameters named write_access or fault_type, nor are any variables declared with those names in the method body. Perhaps that example script works in an older kernel.
I assumed this meant that I would probably be getting untrustworthy output. With the addition of the first error we got (WARNING: cannot find module kernel debuginfo: No DWARF information found [man warning::debuginfo]), I went back to google with some slightly different keywords, and eventually discovered DWARFless probing.
I rewrote the script using that approach, and then realised that I really didn’t care about the address or the write_access. All I needed was the type of fault, and that was just as easily accessible in the return value of __handle_mm_fault.
I ended up with a script that looks like this
# Trace page faults for a process (and any of its threads?)
#
# Usage: stap process_page_faults.stp -x <pid>;

global fault_entry_time

probe begin {
  printf("systemtap has startedn")
}

probe kernel.function("handle_mm_fault").call!, kernel.function("__handle_mm_fault").call {
  pid = pid()
  if (pid == target())
  {
    id = tid()
    t = gettimeofday_us()
    fault_entry_time[id] = t
  }
}

probe kernel.function("handle_mm_fault").return!, kernel.function("__handle_mm_fault").return {
  pid = pid()
  if (pid == target()) {
    id = tid()
    t = gettimeofday_us()
    if (!(id in fault_entry_time)) next
    start_time = fault_entry_time[id]
    e = t - start_time
    if (e > 1000)
    {
      printf("%d:%d:%d:%d:%d:%dn",
             start_time, t, id, pid, e, returnval())
    }
    #free up memory
    delete fault_entry_time[id]
  }
}
I also wrote a few wrapper scripts to detect the presence of the market data service and appropriately start and stop the systemtap script at the right time.
We start to get the following output:
server not there; waiting a bit
2016-10-14 12:32:52.331562 : 200 OK
mds lbm thread not there yet, waiting a bit
2016-10-14 12:33:07.343710 : 200 OK
2016-10-14 12:33:07.344100 : found lbm tid: 133881
2016-10-14 12:33:07.429192 : found mds pid: 133210
2016-10-14 12:33:07.429236 : ['python', 'kill_stap_on_no_mds.py']
2016-10-14 12:33:07.452395 : ['stap', '-x', '133210', 'process_page_faults.stp']

1475682078014325:1475682078038965:133881:133210:24640:1028
1475682078039052:1475682078079234:133881:133210:40182:1028
1475682078079293:1475682078119595:133881:133210:40302:1028
1475682078119649:1475682078135669:133881:133210:16020:1028
1475682078135731:1475682078157507:133881:133210:21776:1028
1475682078157571:1475682078163527:133881:133210:5956:1028
That’s 147 milliseconds of wall clock time spent attempting to service a major page fault on the LBM thread. (The fifth column is the time spent in microseconds).
If we take that first microsecond timestamp and poke it into epochconverter.com, we get
1475682078014325
Assuming that this timestamp is in microseconds (1/1,000,000 second):
GMT: Wed, 05 Oct 2016 15:41:18 GMT
Splitting that timestamp into seconds (1475682078) and microseconds (014325), we see that we’re only 14 milliseconds into 15:41:18.
Let’s take a look at the OrderBookEvents UDP socket depth at that time:
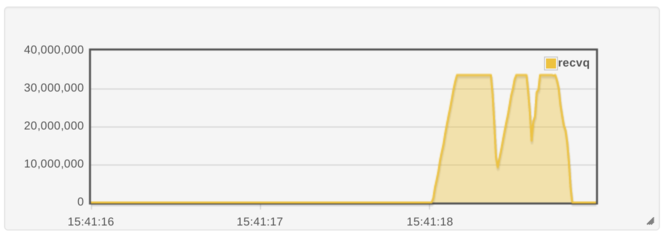
This is excellent news. Now, can we work out what is triggering the fault?
Well, outside of application start/stop time, these are the only faults of significant duration the LBM thread sees. This means we can add further debugging information without worrying too much about data volume, so let’s print a userspace stack trace for each recorded fault using print_ubacktrace.
We go through several cycles fixing warnings of the form
WARNING: missing unwind data for module, rerun with 'stap -d some_module.so'
until we end up with a slightly longer command line
['stap', '-x', '133210', '-d', '/lib64/ld-2.12.so', '-d', '/opt/lbm/lib/liblbm.so.7.0.1', '-d', '/opt/lbm/lib/liblbmj.so.5.0.0', 'process_page_faults.stp']
and stack traces that look a bit like this (only the first is included for space sanity purposes):
 0x30e0e0dfe0 : _dl_fixup+0x2e/0x1c0 [/lib64/ld-2.12.so]
 0x30e0e148f5 : _dl_runtime_resolve+0x35/0x70 [/lib64/ld-2.12.so]
 0x7efeba91b7a3 : lbm_rate_ctlr_handle_timer+0x9e3/0xbe0 [/opt/lbm/lib/liblbm.so.7.0.1]
 0x7efeba879c82 : lbm_timer_expire+0x372/0x490 [/opt/lbm/lib/liblbm.so.7.0.1]
 0x7efeba895eb5 : lbm_context_process_events+0x2d5/0x7f0 [/opt/lbm/lib/liblbm.so.7.0.1]
 0x7efebae54ca1 : Java_com_latencybusters_lbm_LBMContext_lbmContextProcessEvents+0x41/0x80 [/opt/lbm/lib/liblbmj.so.5.0.0]
 0x31d292ad
At this point, I am solidly out of my depth the symbols in ld-2.12.so are opaque to me. I don’t have the source for LBM to work out what’s going on in those frames, either. I enlist help from our systems team, and send an email to Informatica with some questions. We’ll pick up from there in the next post.
- We’ve gone as far as to write monitoring that detects when more than a single thread runs on an isolated core. This has caught several bugs where we’ve forgotten to correctly pin/affinitise a new thread in several applications, but it didn’t found anything wrong here.↩