


Next 24 hours: Updates coming from Jackson Hole
Today’s report: Will the party keep going?
Risk markets have held up well as we head into the latter portion of the week, though that momentum has been fading.
Wake-up call
- Discouraging IFO
- wage increases
- delayed recovery
- Zero-COVID policy
- wholesale sales
- RBNZ turnaround
- Stocks vulnerable
- Dealers report
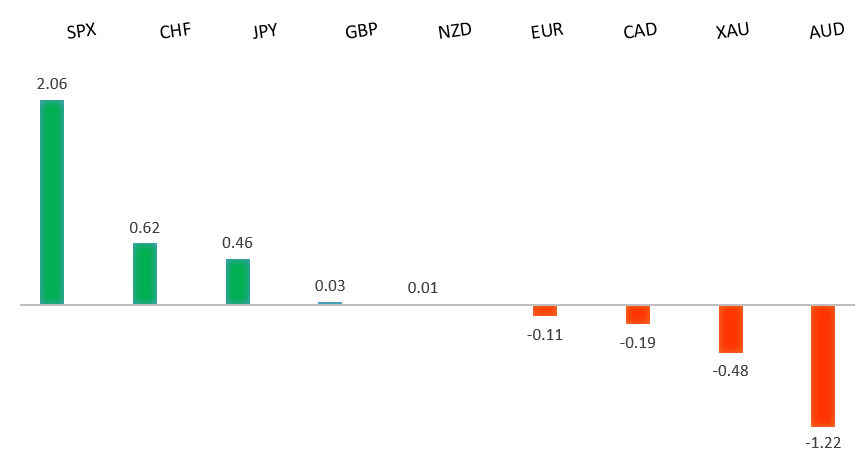
Peformance chart: 30 Day Performance vs. US dollar (%)
Suggested reading
- Can SEC’s Gary Gensler Offer More Than Tough Talk?, S. Ren, Bloomberg (August 25, 2021)
- Banks Are Buying Bonds But They'd Rather Lend, M. Phillips, NY Times (August 25, 2021)
Chart talk: Technical & fundamental highlights
Choose pair:
EURUSD – technical overview
The market has been looking for a higher low since topping out in 2021 up at 1.2350. Ideally, setbacks continue to be well supported down towards 1.1600 in favour of the next major upside extension back through 1.2350 and towards a retest of the 2018 high at 1.2555 further up. Only a weekly close below 1.1600 would force a rethink.EURUSD – fundamental overview
The Euro has been supported in recent sessions on the broad based selling of the US Dollar and record run in US stocks. At the same time, gains have been less than impressive considering, with the single currency perhaps weighed down by Wednesday's discouraging German IFO reads. Key standouts on Thursday’s calendar include Aussie private capex, German GfK consumer confidence, Eurozone money supply, US initial jobless claims and GDP.EURUSD - Technical charts in detail
GBPUSD – technical overview
The market is in a corrective phase in the aftermath of the run to fresh 2021 and multi-month highs. At this stage, additional setbacks should be limited to the 1.3500 area ahead of the next major upside extension towards a retest and break of critical resistance in the form of the 2018 high.GBPUSD – fundamental overview
The Pound got a nice little extra boost on Wednesday from the news of wage increases spreading across sectors. Building companies advertised pay increases of 6.7% from February through July. Key standouts on Thursday’s calendar include Aussie private capex, German GfK consumer confidence, Eurozone money supply, US initial jobless claims and GDP.USDJPY – technical overview
The longer-term trend is bearish despite the recent run higher. Look for additional upside to be limited, with scope for a topside failure and bearish resumption back down towards the 100.00 area. It would take a clear break back above 113.00 to negate the outlook.USDJPY – fundamental overview
The Yen has been mildly offered of late, getting sold on the risk on flow, but also not getting sold too aggressively as the US Dollar remains broadly offered. We've also seen some weakness from the news the BOJ sees a delayed recovery given the infection spread is having a greater impact than expected. Key standouts on Thursday’s calendar include Aussie private capex, German GfK consumer confidence, Eurozone money supply, US initial jobless claims and GDP.AUDUSD – technical overview
The Australian Dollar has been in the process of a healthy correction following the impressive run towards a retest of the 2018 high earlier this year. At this stage, there is risk for additional declines, though setbacks are expected to be well supported down into the 0.7000 area.AUDUSD – fundamental overview
Though the Australian Dollar has rallied on the back of broad USD selling and risk on flow, we haven't seen as much demand given the offsetting factor of a zero-COVID policy and some weaker construction data. Key standouts on Thursday’s calendar include Aussie private capex, German GfK consumer confidence, Eurozone money supply, US initial jobless claims and GDP.USDCAD – technical overview
Finally signs of a major bottom in the works after a severe decline from the 2020 high. A recent weekly close back above 1.2500 encourages the constructive outlook and opens the door for a push back towards next critical resistance in the 1.3000 area. Any setbacks should be well supported into the 1.2200s.USDCAD – fundamental overview
Some relative underperformance in the Canadian Dollar on Wednesday after Canada wholesale sales disappointed. The market is also perhaps a little jittery ahead of the September election. Key standouts on Thursday’s calendar include Aussie private capex, German GfK consumer confidence, Eurozone money supply, US initial jobless claims and GDP.NZDUSD – technical overview
The market has entered a period of consolidation after running up to a yearly and multi-month high. At this stage, there is still room for deeper setbacks into the 0.6500-0.6800 area before we see an attempt at a higher low and resumption of upside pressure.NZDUSD – fundamental overview
It's been a healthy few sessions for the New Zealand Dollar. The currency has been getting a boost from broad based US Dollar selling, record high US equities, better than expected New Zealand retail sales data earlier this week and some damage control out of the RBNZ. The Kiwi rate had taken a hit the other week after the RBNZ failed to hike rates. But on Tuesday, Assistant Governor Hawkesby said the backdown from the rate hike was more about communication challenges than economic risk. Key standouts on Thursday’s calendar include Aussie private capex, German GfK consumer confidence, Eurozone money supply, US initial jobless claims and GDP.US SPX 500 – technical overview
Longer-term technical studies are looking quite exhausted and the market is showing signs of wanting to roll over after racing to another record high. Look for rallies to be well capped above 4500, with a break back below 4353 to strengthen the outlook.US SPX 500 – fundamental overview
We're trading just off fresh record highs, and yet, with so little room for additional central bank accommodation, given an already depressed interest rate environment, the prospect for sustainable runs to the topside on easy money policy incentives and government stimulus, should no longer be as enticing to investors. Meanwhile, ongoing worry associated with coronavirus fallout and risk of rising inflation should weigh more heavily on investor sentiment into the second half of 2021.GOLD (SPOT) – technical overview
The 2019 breakout above the 2016 high at 1375 was a significant development, opening the door for fresh record highs and an acceleration beyond the next major psychological barrier at 2000. Setbacks should now be well supported above 1600.GOLD (SPOT) – fundamental overview
The yellow metal continues to be well supported on dips with solid demand from medium and longer-term accounts. These players are more concerned about exhausted monetary policy, extended global equities, and coronavirus fallout. All of this should keep the commodity well supported, with many market participants also fleeing to the hard asset as the grand dichotomy of record high equities and record low yields comes to an unnerving climax.