


Next 24 hours: Risk is on...but don't expect much
Today’s report: Pre-event risk positioning
It’s really all about consolidation in FX markets ahead of tomorrow’s US NFP release. There’s been a lot of tension ahead of the event risk given the potential impact on the rate outlook.
Wake-up call
- ECB Minutes
- BOE pricing
- Yen bets
- sentiment improves
- energy prices
- virus cases
- Stocks vulnerable
- Dealers report
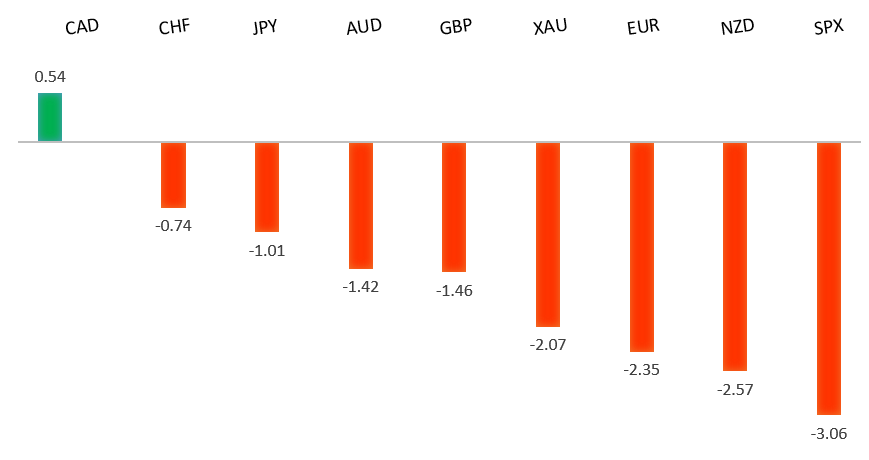
Peformance chart: 30 Day Performance vs. US dollar (%)
Suggested reading
- Gas Market's Wild Ride Shows Some Machiavellian Traits, J. Authers, Bloomberg (October 7, 2021)
- The make-or-break issues facing the COP26 climate summit, L. Hook, Financial Times (October 7, 2021)
Chart talk: Technical & fundamental highlights
Choose pair:
EURUSD – technical overview
The market has been looking for a higher low since topping out in 2021 up at 1.2350. Ideally, setbacks continue to be well supported above 1.1600 on a weekly close basis in favour of the next major upside extension back through 1.2350 and towards a retest of the 2018 high at 1.2555 further up. Only a weekly close below 1.1600 would force a rethink.EURUSD – fundamental overview
The Euro is floundering after sinking to a 15 month low on Wednesday. The hit came from super soft economic data highlighted by German factory orders and Eurozone retail sales. Key standouts on today’s calendar include German industrial production, UK labor productivity, the ECB Minutes, US initial jobless claims, Canada Ivey PMIs and a conference on inflation dynamics held by the Cleveland Fed and ECB.EURUSD - Technical charts in detail
GBPUSD – technical overview
The market is in a consolidation phase in the aftermath of the run to fresh 2021 and multi-month highs. At this stage, additional setbacks should be limited to the 1.3200 area ahead of the next major upside extension towards a retest and break of critical resistance in the form of the 2018 high.GBPUSD – fundamental overview
Rising rate expectations in the UK have helped to prop up the Pound despite ongoing broad based demand for the US Dollar. The UK rate market is now pricing a 90% chance for a December hike. UK construction PMIs did come in softer on Wednesday and spiking energy prices are a worry with respect to slower growth implications. Key standouts on today’s calendar include German industrial production, UK labor productivity, the ECB Minutes, US initial jobless claims, Canada Ivey PMIs and a conference on inflation dynamics held by the Cleveland Fed and ECB.USDJPY – technical overview
The longer-term trend is bearish despite the recent run higher. Look for additional upside to be limited, with scope for a topside failure and bearish resumption back down towards the 100.00 area. It would take a clear break back above 113.00 to negate the outlook.USDJPY – fundamental overview
More Yen weakness into Thursday, with the price action easily attributable to risk on flow. At the same time, there is plenty of worry around betting on more meaningful Yen weakness in the absence of fresh macro cues, especially with risk off being so much more prominent these days. Key standouts on today’s calendar include German industrial production, UK labor productivity, the ECB Minutes, US initial jobless claims, Canada Ivey PMIs and a conference on inflation dynamics held by the Cleveland Fed and ECB.AUDUSD – technical overview
The Australian Dollar has been in the process of a healthy correction following the impressive run towards a retest of the 2018 high earlier this year. At this stage, there is risk for additional declines, though setbacks are expected to be well supported down into the 0.7000 area. Look for a weekly close above 0.7500 to force a shift in the structure.AUDUSD – fundamental overview
The Australian Dollar has been in recovery mode in recent sessions, getting a big boost from the latest resurgence in risk appetite. Key standouts on today’s calendar include German industrial production, UK labor productivity, the ECB Minutes, US initial jobless claims, Canada Ivey PMIs and a conference on inflation dynamics held by the Cleveland Fed and ECB.USDCAD – technical overview
Finally signs of a major bottom in the works after a severe decline from the 2020 high. A recent weekly close back above 1.2500 encourages the constructive outlook and opens the door for a push back towards next critical resistance in the 1.3000 area. Any setbacks should be well supported into the 1.2200s.USDCAD – fundamental overview
The Canadian Dollar has rallied in recent sessions and has been a clear outperformer over the past month, largely on the back of the big moves we're seeing in the price of oil and natural gas. Key standouts on today’s calendar include German industrial production, UK labor productivity, the ECB Minutes, US initial jobless claims, Canada Ivey PMIs and a conference on inflation dynamics held by the Cleveland Fed and ECB.NZDUSD – technical overview
The market has entered a period of consolidation after running up to a yearly and multi-month high. At this stage, rallies should be well capped and there is still room for deeper setbacks into the 0.6500-0.6800 area before we see an attempt at a higher low and resumption of upside pressure. Back above the April high at 0.7317 would be required to force a shift in the structure.NZDUSD – fundamental overview
The New Zealand Dollar's performance has been less than impressive in the aftermath of this week's RBNZ rate hike. It seems the fact that the hike was priced in and the latest uptick in coronavirus cases in New Zealand are offsetting a lot of the positive flow at the moment. Key standouts on today’s calendar include German industrial production, UK labor productivity, the ECB Minutes, US initial jobless claims, Canada Ivey PMIs and a conference on inflation dynamics held by the Cleveland Fed and ECB.US SPX 500 – technical overview
Longer-term technical studies are looking quite exhausted and the market is showing signs of wanting to roll over after racing to another record high. Look for rallies to be well capped ahead of 4600, with a break back below 4353 to strengthen the outlook.US SPX 500 – fundamental overview
We're trading just off fresh record highs, and yet, with so little room for additional central bank accommodation, given an already depressed interest rate environment, the prospect for sustainable runs to the topside on easy money policy incentives and government stimulus, should no longer be as enticing to investors. Meanwhile, ongoing worry associated with coronavirus fallout and risk of rising inflation should weigh more heavily on investor sentiment into Q4 2021.GOLD (SPOT) – technical overview
The 2019 breakout above the 2016 high at 1375 was a significant development, opening the door for fresh record highs and an acceleration beyond the next major psychological barrier at 2000. Setbacks should now be well supported above 1600.GOLD (SPOT) – fundamental overview
The yellow metal continues to be well supported on dips with solid demand from medium and longer-term accounts. These players are more concerned about exhausted monetary policy, extended global equities, and coronavirus fallout. All of this should keep the commodity well supported, with many market participants also fleeing to the hard asset as the grand dichotomy of record high equities and record low yields comes to an unnerving climax. [audio mp3="https://www.lmax.com/blog/wp-content/uploads/sites/4/2021/09/15seplmaxaudio.mp3"][/audio]