


Next 24 hours: Monetary policy and inflation
Today’s report: Rising oil, soft China data to start week
The mix of an ongoing surge in the price of oil, which has stoked inflationary concerns, and a round of less than stellar economic data out of China, have been behind some of the profit taking in risk assets we’re seeing on this Monday.
Wake-up call
- inflation rhetoric
- GBPUSDGilts outperform on energy surge
- growth forecast
- China data
- economic data
- NZDUSD Rising infections have been a headache
- Stocks vulnerable
- Dealers report
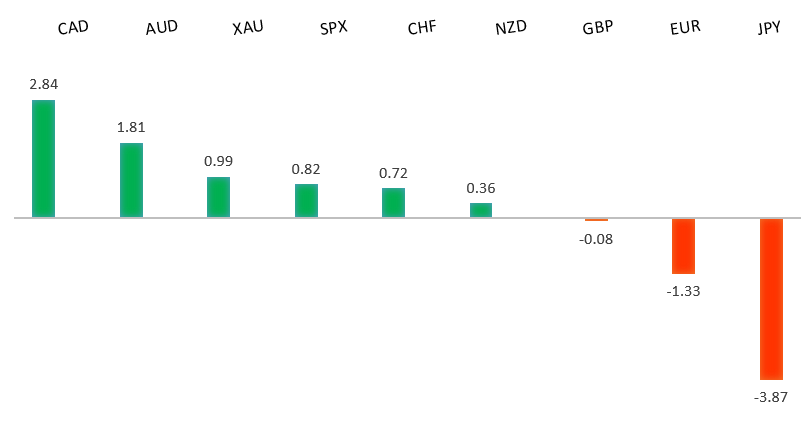
Peformance chart: 30 Day Performance vs. US dollar (%)
Suggested reading
- Bitcoin's Super-Swift Rebound May Have Been Made in China, J. Authers, Bloomberg (October 18, 2021)
- Is China's Economic Model Broken?, J. Kynge, Financial Post (October 15, 2021)
Chart talk: Technical & fundamental highlights
Choose pair:
EURUSD – technical overview
The market has been looking for a higher low since topping out in 2021 up at 1.2350. Ideally, setbacks continue to be well supported above 1.1500 on a weekly close basis in favour of the next major upside extension back through 1.2350 and towards a retest of the 2018 high at 1.2555 further up. Only a weekly close below 1.1500 would force a rethink.EURUSD – fundamental overview
The Euro has found renewed offers into rallies as the ECB sticks to its low inflation rhetoric. ECB Wunsch was out the other day saying the inflation spike was temporary. Meanwhile, the plunge in European car sales also hasn't helped matters. Key standouts on Monday’s calendar include Canada housing starts, US industrial production, the Bank of Canada business outlook survey, and US NAHB housing.EURUSD - Technical charts in detail
GBPUSD – technical overview
The market is in a consolidation phase in the aftermath of the run to fresh 2021 and multi-month highs. At this stage, additional setbacks should be limited to the 1.3200 area ahead of the next major upside extension towards a retest and break of critical resistance in the form of the 2018 high.GBPUSD – fundamental overview
The Pound has received a prop on rising Gilt yields. Gilt yields have outperformed European counterparts as energy prices continue to surge. Nearly 90 bps of BOE rate hikes are now priced by the end of 2022. EURGBP has sunk to its lowest levels since February of 2020. Key standouts on Monday’s calendar include Canada housing starts, US industrial production, the Bank of Canada business outlook survey, and US NAHB housing.USDJPY – technical overview
The longer-term trend is bearish despite the recent run higher. Look for additional upside to be limited, with scope for a topside failure and bearish resumption back down towards the 100.00 area. It would take a clear break back above 114.55 to negate the outlook.USDJPY – fundamental overview
The BOJ was out saying it was considering lower growth forecast for the upcoming fiscal year. The Yen remains heavily offered given positive risk sentiment in US equities and perceived monetary policy divergence between the BOJ and it's global counterparts. Key standouts on Monday’s calendar include Canada housing starts, US industrial production, the Bank of Canada business outlook survey, and US NAHB housing.AUDUSD – technical overview
The Australian Dollar has been in the process of a healthy correction following the impressive run towards a retest of the 2018 high earlier this year. At this stage, there is risk for additional declines, though setbacks are expected to be well supported down into the 0.7000 area. Look for a weekly close above 0.7500 to force a shift in the structure.AUDUSD – fundamental overview
The Australian Dollar had briefly edged higher in early trade, tracking Kiwi strength and also boosted by Australia's rising vaccination rate. However, offers were quick to emerge on some risk off flow from concerning China reads and lower US equity futures. Key standouts on Monday’s calendar include Canada housing starts, US industrial production, the Bank of Canada business outlook survey, and US NAHB housing.USDCAD – technical overview
Finally signs of a major bottom in the works after a severe decline from the 2020 high. A recent weekly close back above 1.2500 encourages the constructive outlook and opens the door for a push back towards next critical resistance in the 1.3000 area. Any setbacks should be well supported into the 1.2200s.USDCAD – fundamental overview
An underwhelming batch of Friday economic data out of Canada has triggered some profit taking on an extended and overcrowded Canadian Dollar long position. Key standouts on Monday’s calendar include Canada housing starts, US industrial production, the Bank of Canada business outlook survey, and US NAHB housing.NZDUSD – technical overview
The market has entered a period of consolidation after running up to a yearly and multi-month high. At this stage, rallies should be well capped and there is still room for deeper setbacks into the 0.6500-0.6800 area before we see an attempt at a higher low and resumption of upside pressure. Back above the April high at 0.7317 would be required to force a shift in the structure.NZDUSD – fundamental overview
New Zealand is considering new restrictions in Auckland amid rising infection. This has taken some of the wind out of the sail of the latest rally we had seen on the back of some very hot inflation data. Key standouts on Monday’s calendar include Canada housing starts, US industrial production, the Bank of Canada business outlook survey, and US NAHB housing.US SPX 500 – technical overview
Longer-term technical studies are looking quite exhausted and the market is showing signs of wanting to roll over after racing to another record high. Look for rallies to be well capped ahead of 4600, with a break back below 4353 to strengthen the outlook.US SPX 500 – fundamental overview
We're trading just off fresh record highs, and yet, with so little room for additional central bank accommodation, given an already depressed interest rate environment, the prospect for sustainable runs to the topside on easy money policy incentives and government stimulus, should no longer be as enticing to investors. Meanwhile, ongoing worry associated with coronavirus fallout and risk of rising inflation should weigh more heavily on investor sentiment into Q4 2021.GOLD (SPOT) – technical overview
The 2019 breakout above the 2016 high at 1375 was a significant development, opening the door for fresh record highs and an acceleration beyond the next major psychological barrier at 2000. Setbacks should now be well supported above 1600.GOLD (SPOT) – fundamental overview
The yellow metal continues to be well supported on dips with solid demand from medium and longer-term accounts. These players are more concerned about exhausted monetary policy, extended global equities, and coronavirus fallout. All of this should keep the commodity well supported, with many market participants also fleeing to the hard asset as the grand dichotomy of record high equities and record low yields comes to an unnerving climax. [audio mp3="https://www.lmax.com/blog/wp-content/uploads/sites/4/2021/09/15seplmaxaudio.mp3"][/audio]