


Next 24 hours: Mixed start to the week
Today’s report: Quiet start to holiday thin week
It’s going to be a short week for financial markets, with the US heading off mid-week for the Thanksgiving holiday break. And Monday is already a quiet day on the calendar. So we’re not sure how much activity market participants should be expecting.
Wake-up call
- growth prospects
- casts doubt
- PM Kishida
- iron ore
- Oil decline
- hike odds
- Stocks vulnerable
- Dealers report
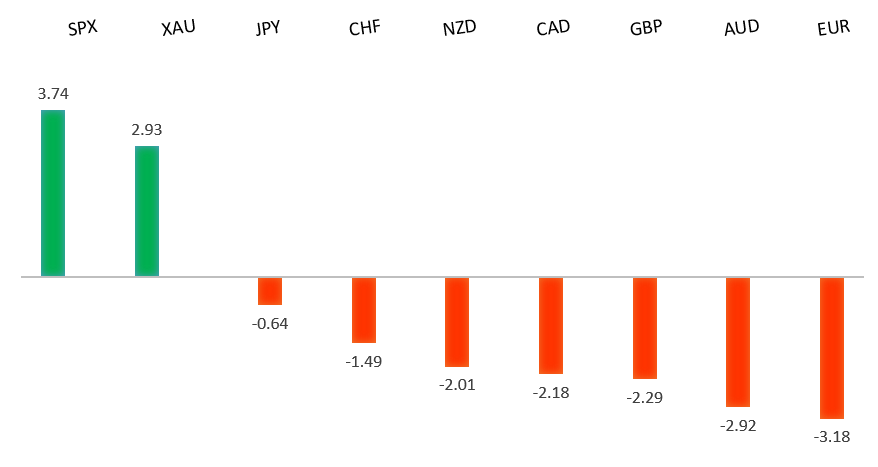
Peformance chart: 30 Day Performance vs. US dollar (%)
Suggested reading
- It’s Beginning to Look a Lot Like Normal, L. Williams, Bloomberg (November 21, 2021)
- Cryptocurrencies: How Regulators Lost Control, D. Garrahan, Financial Times (November 16, 2021)
Chart talk: Technical & fundamental highlights
Choose pair:
EURUSD – technical overview
Setbacks have extended to retest the critical 61.8% fib retrace off the 2020 low to 2021 high move. Technical studies are now tracking in extended territory on the weekly chart, warning of the need for a corrective bounce ahead. Look for the market to hold up on a weekly close basis above the 61.8% fib retrace around 1.1275.EURUSD – fundamental overview
The Euro sits just off fresh yearly lows as European growth prospects dim. A full lockdown in Austria could be warning of broader restrictions. At the same time, German producer prices have spiked at their highest pace since 1951. Key standouts on today’s calendar come in the form of Canada wholesales sales, the Chicago Fed national activity index, and US existing home sales.EURUSD - Technical charts in detail
GBPUSD – technical overview
The market is in a correction phase in the aftermath of the run to fresh multi-month highs earlier this year. At this stage, additional setbacks should be limited to the 1.3200 area ahead of the next major upside extension towards a retest and break of critical resistance in the form of the 2018 high.GBPUSD – fundamental overview
The Pound came under some more pressure after the BOE cast doubt on the prospect for a December rate hike. UK retail sales did help the Pound a bit into the dip after coming in above forecast and putting in the first rise in six months. Key standouts on today’s calendar come in the form of Canada wholesales sales, the Chicago Fed national activity index, and US existing home sales.USDJPY – technical overview
The longer-term trend is bearish despite the recent run higher. Look for additional upside to be limited, with scope for a topside failure and bearish resumption back down towards the 100.00 area. It would take a clear break back above 114.55 to negate the outlook.USDJPY – fundamental overview
The Yen is coming out of a Friday where it got a modest haven bid on the move lower in US stocks. Meanwhile, PM Kishida was on the wires talking massive fiscal stimulus, expected at more than 10% of GDP. Kishida claims it will boost the economy by 5.6%. Key standouts on today’s calendar come in the form of Canada wholesales sales, the Chicago Fed national activity index, and US existing home sales.AUDUSD – technical overview
The Australian Dollar has been in the process of a healthy consolidation following the impressive run towards a retest of the 2018 high earlier this year. At this stage, there are signs of the market wanting to turn back up and any setbacks should be well supported down into the 0.7200 area. Look for a weekly close above 0.7500 to strengthen the outlook and force a shift in the structure.AUDUSD – fundamental overview
The Australian Dollar has been under pressure overall in recent sessions, mostly on the back of discouraging local data and some negative sentiment. However, the latest rebound in the price of iron ore has helped to support the market on dips. Key standouts on today’s calendar come in the form of Canada wholesales sales, the Chicago Fed national activity index, and US existing home sales.USDCAD – technical overview
Finally signs of a major bottom in the works after a severe decline from the 2020 high. A recent weekly close back above 1.2500 encourages the constructive outlook and opens the door for a push back towards next critical resistance in the 1.3000 area. Any setbacks should be well supported into the 1.2200s.USDCAD – fundamental overview
On Friday, Canada retail sales came in better than expected, but were still in the negative. Meanwhile, broader risk sentiment took a bit of a hit and oil continued to extend its correction. Key standouts on today’s calendar come in the form of Canada wholesales sales, the Chicago Fed national activity index, and US existing home sales.NZDUSD – technical overview
The market has entered a period of consolidation after running up to a yearly and multi-month high. Back above the April high at 0.7317 would be required to force a shift in the structure.NZDUSD – fundamental overview
The New Zealand Dollar has held up relatively well in recent sessions. We see this reconciled by the fact that New Zealand producer prices have shot up to their highest levels in a decade, which has increased odds of more RBNZ hikes ahead. Key standouts on today’s calendar come in the form of Canada wholesales sales, the Chicago Fed national activity index, and US existing home sales.US SPX 500 – technical overview
Longer-term technical studies are looking quite exhausted and the market is showing signs of wanting to roll over after racing to another record high. At the same time, the latest breakout above 4600 introduces the possibility for the next major upside extension through 4800. At this stage, it will take a break back below 4500 to take the immediate pressure off the topside.US SPX 500 – fundamental overview
We're trading just off fresh record highs, and yet, with so little room for additional central bank accommodation, given an already depressed interest rate environment, the prospect for sustainable runs to the topside on easy money policy incentives and government stimulus, should no longer be as enticing to investors. Meanwhile, ongoing worry associated with coronavirus fallout and risk of rising inflation should weigh more heavily on investor sentiment in Q4 2021.GOLD (SPOT) – technical overview
The 2019 breakout above the 2016 high at 1375 was a significant development, opening the door for fresh record highs and an acceleration beyond the next major psychological barrier at 2000. Setbacks should now be well supported above 1600.GOLD (SPOT) – fundamental overview
The yellow metal continues to be well supported on dips with solid demand from medium and longer-term accounts. These players are more concerned about exhausted monetary policy, extended global equities, and coronavirus fallout. All of this should keep the commodity well supported, with many market participants also fleeing to the hard asset as the grand dichotomy of record high equities and record low yields comes to an unnerving climax.