


Next 24 hours: Risk on keeps on
Today’s report: More correction than anything else
Softer China inflation reads have opened the door for more stimulus, and global markets love hearing any stories involving additional stimulus. We’ve also seen an uptick in hawkish talk out from other central banks around the globe.
Wake-up call
- ECB Lagarde
- Truss government
- BOJ Kuroda
- China property
- jobs miss
- Bright spots
- Inflation headache
- Dealers report
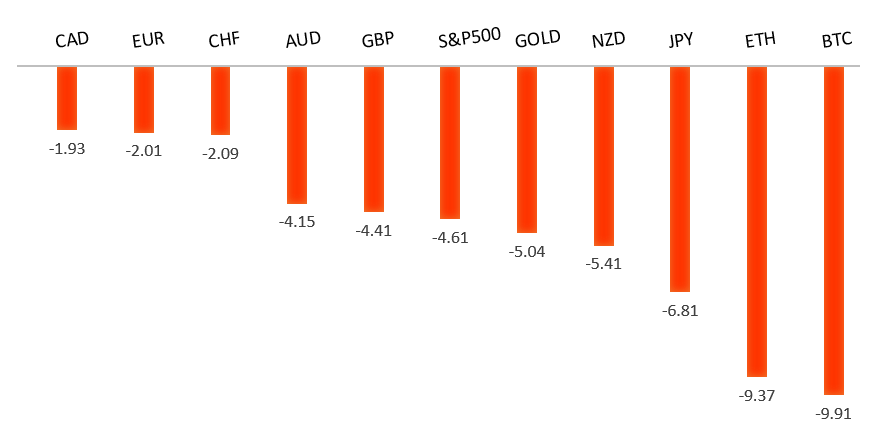
Peformance chart: 30 Day Performance vs. US dollar (%)
Suggested reading
- Tips on Survival From the Queen Who Excelled at It, J. Authers, Bloomberg (September 9, 2022)
- Breaking Into the Livestream Shopping Market, D. Lee, Financial Times (September 12, 2022)
Chart talk: Technical & fundamental highlights
Choose pair:
EURUSD – technical overview
The market has come under intense pressure in recent months, with setbacks accelerating below the critical multi-year low from 2017 at 1.0340. This has set up a dip below monumental support in the form of parity. At the same time, technical studies are tracking in oversold territory, suggesting additional setbacks should be limited. Back above 1.0500 would be required to take the immediate pressure off the downside.EURUSD – fundamental overview
The Euro traded higher after ECB Lagarde offered a liquidity line to the banks amidst the ongoing energy crisis. German 2-year yields also traded to their highest level in a decade on hawkish ECB communications. Key standouts on Monday’s calendar come from UK trade, GDP, construction output, and industrial production, ECB speak, the German current account, and US consumer inflation expectations.EURUSD - Technical charts in detail
GBPUSD – technical overview
The market continues to be exceptionally well supported on dips below 1.2000. At the same time, there is now risk for a retest of the multi-year low from 2020 down in the 1.1400 area before we see the formation of a base and the next big push back through 1.2000. Back above 1.1761 takes the immediate pressure off the downside.GBPUSD – fundamental overview
The Pound has been feeling better about the fact that the Truss government will be looking to expand energy production and lift the fracking ban. Meanwhile, the BOE has opted to push back its next policy meeting to September 22, in light of the Queen's death. Key standouts on Monday’s calendar come from UK trade, GDP, construction output, and industrial production, ECB speak, the German current account, and US consumer inflation expectations.USDJPY – technical overview
Technical studies are looking quite stretched on the longer-term chart, warning of consolidation and correction in the days and weeks ahead. Look for additional upside from here to be well capped into the 145.00 area. Next key support comes in at 140.25.USDJPY – fundamental overview
It seems the combination of comments from BOJ Kuroda that a rapid weakening in the Yen was undesirable, and a meeting between the BOJ, MoF, and FSA, have finally helped to inspire some profit taking on Yen shorts. We've also seen broad based selling in the US Dollar. Key standouts on Monday’s calendar come from UK trade, GDP, construction output, and industrial production, ECB speak, the German current account, and US consumer inflation expectations.AUDUSD – technical overview
Overall pressure remains on the downside despite the recent recovery and conditions remain quite choppy. A break back above 0.7137 would be required to take the pressure off the downside. Until then, scope exists for a lower top below 0.7284 and deeper setbacks towards 0.6500.AUDUSD – fundamental overview
The rebound in China property, rally in commodities, and recovery in US equities, have all helped to inspire upside in the Australian Dollar. Key standouts on Monday’s calendar come from UK trade, GDP, construction output, and industrial production, ECB speak, the German current account, and US consumer inflation expectations.USDCAD – technical overview
A recent surge back above 1.3000 signals an end to a period of bearish consolidation and suggests the market is in the process of carving out a more significant longer-term base. Next key resistance now comes in up into the 1.3500 area. Setbacks should be very well supported down into the 1.2500 area.USDCAD – fundamental overview
Though the Canadian Dollar was stronger against the Buck to close out the week, it did underperform against its peers on the back of a bad jobs miss. Canada's net employment change came in much softer than expected. At the same time, the fact that wages continued to rise was somewhat offsetting. Key standouts on Monday’s calendar come from UK trade, GDP, construction output, and industrial production, ECB speak, the German current account, and US consumer inflation expectations.NZDUSD – technical overview
Overall pressure remains on the downside despite the recent recovery and conditions remain quite choppy. A break back above 0.6251 would be required to take the pressure off the downside. Until then, scope exists for deeper setbacks towards 0.5500.NZDUSD – fundamental overview
A round of profit taking on US Dollar longs and a recovery in US equities have helped to inspire a well needed bounce in the New Zealand Dollar out from this week's fresh yearly low. We've also seen some solid New Zealand data as reflected through the heavy traffic index and retail credit card spending. Key standouts on Monday’s calendar come from UK trade, GDP, construction output, and industrial production, ECB speak, the German current account, and US consumer inflation expectations.US SPX 500 – technical overview
Longer-term technical studies are in the process of unwinding from extended readings off record highs. Look for rallies to be well capped in favor of lower tops and lower lows. Back above 4,328 will be required at a minimum to take the immediate pressure off the downside. Next major support comes in around 3,400.US SPX 500 – fundamental overview
We've finally reached a point in the cycle where the Fed recognizes unanchored inflation expectations pose a greater downside risk than over-tightening. This is significant, as it means less investor friendly monetary policy that risks potential recession in the months ahead. We have seen an attempt at recovery in recent weeks, with softer CPI reads helping. But overall, we expect inflation to continue to be a problem that results in renewed downside pressure into rallies.GOLD (SPOT) – technical overview
The 2019 breakout above the 2016 high at 1375 was a significant development, opening the door for fresh record highs. Setbacks should now be well supported above 1700 on a monthly close basis.GOLD (SPOT) – fundamental overview
The yellow metal continues to be well supported on dips with solid demand from medium and longer-term accounts. These players are more concerned about inflation risk and a less upbeat global growth outlook. All of this should keep the commodity well supported, with many market participants also fleeing to the hard asset as the grand dichotomy of record high equities and record low yields comes to an unnerving climax.