


Today’s report: A better look into Friday
There’s been a little bit of a delay in reaction, but currencies are finally recovering against the US Dollar into Friday. Thursday’s 75 basis point rate hike from the ECB didn’t do much for the Euro in the initial aftermath, but we are now seeing the Euro charge higher back above parity and inviting the other currencies to come along for the ride.
Wake-up call
- ECB aftermath
- fracking ban
- BOJ Kuroda
- RBA Lowe
- rate hike
- risk sentiment
- Inflation headache
- Dealers report
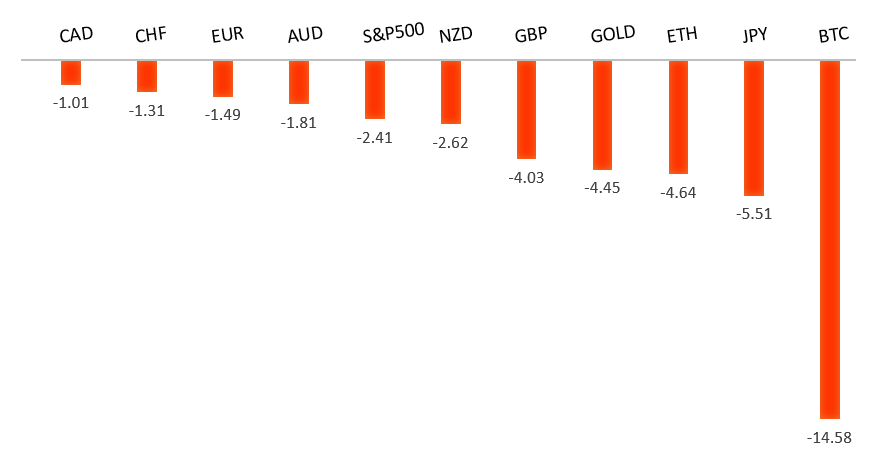
Peformance chart: 30 Day Performance vs. US dollar (%)
Suggested reading
- Nothing Will Stop the Dollar From Getting Stronger, J. Authers, Bloomberg (September 9, 2022)
- How Putin Held Europe Hostage Over Energy, J. Sandy, Financial Times (September 8, 2022)
Chart talk: Technical & fundamental highlights
Choose pair:
EURUSD – technical overview
The market has come under intense pressure in recent months, with setbacks accelerating below the critical multi-year low from 2017 at 1.0340. This has set up a dip below monumental support in the form of parity. At the same time, technical studies are tracking in oversold territory, suggesting additional setbacks should be limited. Back above 1.0500 would be required to take the immediate pressure off the downside.EURUSD – fundamental overview
The Euro was initially unimpressed with the as expected ECB 75 basis point rate hike, but has since started to rally, helped along by broad based profit taking on US Dollar longs. Meanwhile, the German government announced EUR40 billion in energy relief, which comes on the back of two previous plans totaling EUR30 billion. Key standouts on Friday’s calendar come from an ECB Lagarde appearance. Canada employment data, a wave of Fed speak, and the EU emergency energy meeting.EURUSD - Technical charts in detail
GBPUSD – technical overview
The market continues to be exceptionally well supported on dips below 1.2000. At the same time, there is now risk for a retest of the multi-year low from 2020 down in the 1.1400 area before we see the formation of a base and the next big push back through 1.2000. Back above 1.1761 takes the immediate pressure off the downside.GBPUSD – fundamental overview
The Pound is finally finding some demand into Friday after a tough week which saw the currency sink to fresh multi-year lows. Concerning UK fiscal policies had exacerbated declines, though there has been some optimism around the news that the UK fracking ban is expected to be scrapped. Most of the GBP demand is coming from some end of week profit taking on US Dollar longs. Key standouts on Friday’s calendar come from Canada employment data, a wave of Fed speak, and the EU emergency energy meeting.USDJPY – technical overview
Technical studies are looking quite stretched on the longer-term chart, warning of consolidation and correction in the days and weeks ahead. Look for additional upside from here to be well capped into the 145.00 area. Next key support comes in at 140.25.USDJPY – fundamental overview
It seems the combination of comments from BOJ Kuroda that a rapid weakening in the Yen was undesirable, and a meeting between the BOJ, MoF, and FSA, have finally helped to inspire some profit taking on Yen shorts. We've also seen broad based selling in the US Dollar. Key standouts on Friday’s calendar come from Canada employment data, a wave of Fed speak, and the EU emergency energy meeting.AUDUSD – technical overview
Overall pressure remains on the downside despite the recent recovery and conditions remain quite choppy. A break back above 0.7137 would be required to take the pressure off the downside. Until then, scope exists for a lower top below 0.7284 and deeper setbacks towards 0.6500.AUDUSD – fundamental overview
The Australian Dollar has received a big boost into Friday on the back of broad based US Dollar selling and a resurgence in demand for US equities. At the same time, we wonder how much more this run has when considering recent dovish comments from RBA Lowe who hinted at a slower pace of hikes as the cash rate rises. Key standouts on Friday’s calendar come from Canada employment data, a wave of Fed speak, and the EU emergency energy meeting.USDCAD – technical overview
A recent surge back above 1.3000 signals an end to a period of bearish consolidation and suggests the market is in the process of carving out a more significant longer-term base. Next key resistance now comes in up into the 1.3500 area. Setbacks should be very well supported down into the 1.2500 area.USDCAD – fundamental overview
Bank of Canada Rogers was out with hawkish talk on Thursday, the US Dollar has come under broad pressure, oil is recovering, and US equities are trading back up. All of this has contributed to the latest recovery in the Canadian Dollar. Key standouts on Friday’s calendar come from Canada employment data, a wave of Fed speak, and the EU emergency energy meeting.NZDUSD – technical overview
Overall pressure remains on the downside despite the recent recovery and conditions remain quite choppy. A break back above 0.6251 would be required to take the pressure off the downside. Until then, scope exists for deeper setbacks towards 0.5500.NZDUSD – fundamental overview
A round of profit taking on US Dollar longs and a recovery in US equities have helped to inspire a well needed bounce in the New Zealand Dollar out from this week's fresh yearly low. Key standouts on Friday’s calendar come from Canada employment data, a wave of Fed speak, and the EU emergency energy meeting.US SPX 500 – technical overview
Longer-term technical studies are in the process of unwinding from extended readings off record highs. Look for rallies to be well capped in favor of lower tops and lower lows. Back above 4,328 will be required at a minimum to take the immediate pressure off the downside. Next major support comes in around 3,400.US SPX 500 – fundamental overview
We've finally reached a point in the cycle where the Fed recognizes unanchored inflation expectations pose a greater downside risk than over-tightening. This is significant, as it means less investor friendly monetary policy that risks potential recession in the months ahead. We have seen an attempt at recovery in recent weeks, with softer CPI reads helping. But overall, we expect inflation to continue to be a problem that results in renewed downside pressure into rallies.GOLD (SPOT) – technical overview
The 2019 breakout above the 2016 high at 1375 was a significant development, opening the door for fresh record highs. Setbacks should now be well supported above 1700 on a monthly close basis.GOLD (SPOT) – fundamental overview
The yellow metal continues to be well supported on dips with solid demand from medium and longer-term accounts. These players are more concerned about inflation risk and a less upbeat global growth outlook. All of this should keep the commodity well supported, with many market participants also fleeing to the hard asset as the grand dichotomy of record high equities and record low yields comes to an unnerving climax.