


Next 24 hours: US equity futures up off the lows
Today’s report: Everything and the kitchen sink
Recent measures by the major central banks have failed to quiet anxiety about vulnerabilities in the bank sector. The Fed, BOE, Bank of Canada, ECB, BOJ and SNB all announced they would be boosting liquidity in US Dollar swap lines.
Wake-up call
- USD weakness
- Sunak teases
- Fed repricing
- rallying metals
- energy prices
- safe haven
- Inflation headache
- Dealers report
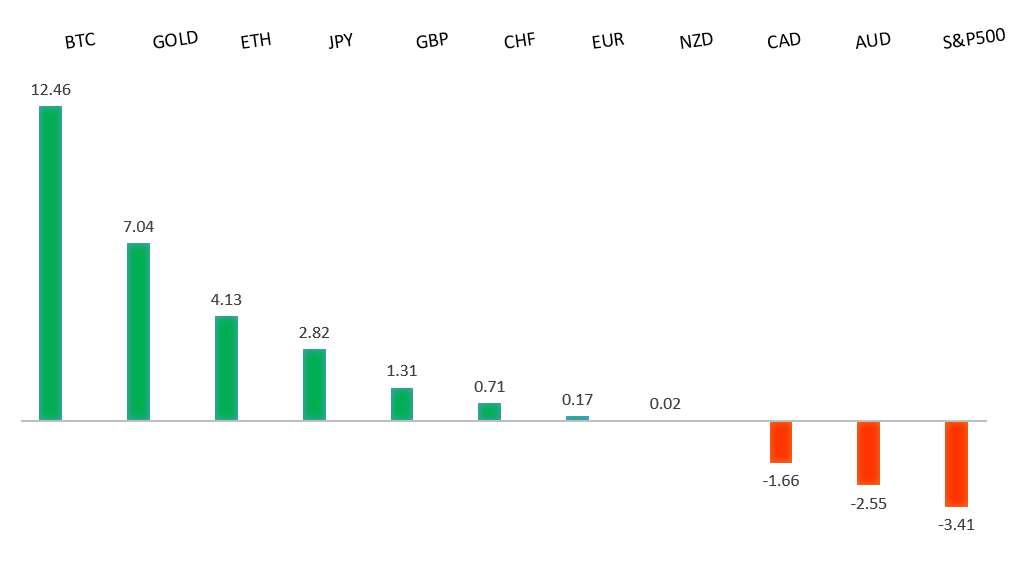
Peformance chart: 30 Day Performance vs. US dollar (%)
Suggested reading
- SVB Sends Tremors Across the Banking Landscape, B. Sample, Bloomberg (March 18, 2023)
- The Opportunity In SVB's Collapse, A. Amilibia, Evergreen Gavekal (March 16, 2023)
Chart talk: Technical & fundamental highlights
Choose pair:
EURUSD – technical overview
The Euro is in the throes of a correction following a run to the topside through 1.1000 earlier this year. Any additional setbacks should be well supported ahead of 1.0300 in favor of the formation of the next major higher low and a bullish continuation. Ultimately, only a monthly close back below parity would give reason for concern.EURUSD – fundamental overview
The Euro has recovered on US Dollar weakness and more hawkish ECB expectations following last week's 50 basis point rate hike. At this stage, it will be interesting to see how things unfold with respect to the Fed rate decision later this week. On the data front, Eurozone Q4 labor costs jumped 5.7% y/y from 3.7% previous. Key standouts on Monday’s calendar come from German producer prices, Eurozone trade, and an ECB Lagarde speech.EURUSD - Technical charts in detail
GBPUSD – technical overview
Signs have emerged of the market wanting to put in a longer-term base after collapsing to a record low in September 2022. The recent weekly close back above the September high at 1.1739 strengthens this prospect. Any setbacks should now be well supported ahead of 1.1500. Next key resistance comes in at 1.2668.GBPUSD – fundamental overview
The Pound got another boost into the end of last week on the US Dollar selloff. Meanwhile, also helping was a brightening of the UK outlook. A poll showed 12-month inflation down to 3.9% from 4.8% previous. And Sunak was out teasing about tax cuts if inflation fell below 3% by year end. Key standouts on Monday’s calendar come from German producer prices, Eurozone trade, and an ECB Lagarde speech.USDJPY – technical overview
The major pair has seen a nice recovery following the massive correction out from multi-year highs. Setbacks have finally been well supported ahead of 125.00 in the 127s thus far. At this stage, it looks like the market could be wanting to resume the bigger picture uptrend and head back towards a retest of that multi-year high from October 2022 up at 151.95. Look for any weakness to continue to be well supported in favor of higher lows along the way.USDJPY – fundamental overview
A good chunk of this latest wave of flow back into the Yen comes from a repricing of Fed expectations in light of the US bank woes. Earlier today, the BOJ March meeting summary of opinions was out but offered little new insights or updates with respect to the monetary policy outlook. Key standouts on Monday’s calendar come from German producer prices, Eurozone trade, and an ECB Lagarde speech.AUDUSD – technical overview
There are signs of the potential formation of a longer-term base following the late 2022 surge back above 0.6500. The recent weekly close back above previous support now turned resistance at 0.6682 strengthens the outlook for a bullish structural shift. Next key resistance comes in at 0.7284. Setbacks should be well supported ahead of 0.6500.AUDUSD – fundamental overview
The Australian Dollar has been in recovery mode on the combination of broad US Dollar selling, rallying metals prices, and Australia distance from the current banking woes. Key standouts on Monday’s calendar come from German producer prices, Eurozone trade, and an ECB Lagarde speech.USDCAD – technical overview
A recent surge back above 1.3000 signals an end to a period of bearish consolidation and suggests the market is in the process of carving out a more significant longer-term base. Next key resistance now comes in up into the 1.4000 area. Setbacks should be very well supported down into the 1.3000 area.USDCAD – fundamental overview
Ongoing weakness in energy prices has been a major drag on the Canadian Dollar. Meanwhile, on the data front, Canada industrial product prices missed badly, and raw materials prices were also a miss. Key standouts on Monday’s calendar come from German producer prices, Eurozone trade, and an ECB Lagarde speech.NZDUSD – technical overview
Overall pressure remains on the downside with the market once again stalling out on a run up into the 0.6500 area. Ultimately, a break back above 0.6577 would be required to take the immediate pressure off the downside.NZDUSD – fundamental overview
The New Zealand Dollar has done well in recent sessions, mostly on the consideration of the currency being viewed as a regional safe haven, with good distance from all of the banking woes in the US and Europe. Broad US Dollar selling and rallying metals prices have also helped the commodity currency. Key standouts on Monday’s calendar come from German producer prices, Eurozone trade, and an ECB Lagarde speech.US SPX 500 – technical overview
Longer-term technical studies are in the process of unwinding from extended readings off record highs. Look for rallies to be well capped in favor of lower tops and lower lows. A monthly close back above 4300 will be required at a minimum to take the immediate pressure off the downside. Next major support comes in at 3763.US SPX 500 – fundamental overview
We've finally reached a point in the cycle where the Fed recognizes unanchored inflation expectations pose a greater downside risk than over-tightening. This is significant, as it means less investor friendly monetary policy that risks potential recession in the months ahead. Overall, we expect inflation to continue to be a problem in H1 2023 that results in downside pressure into rallies.GOLD (SPOT) – technical overview
The 2019 breakout above the 2016 high at 1375 was a significant development, opening the door for fresh record highs. Setbacks should now be well supported above 1600 on a monthly close basis ahead of the next major upside extension. The recent break back above 1808 strengthens the bullish outlook. Next major resistance comes in at 2000.GOLD (SPOT) – fundamental overview
The yellow metal continues to be well supported on dips with solid demand from medium and longer-term accounts. These players are more concerned about inflation risk and a less upbeat global growth outlook. All of this should keep the commodity well supported, with many market participants also fleeing to the hard asset as the grand dichotomy of record high equities and record low yields comes to an unnerving climax.