


Today’s report: Calls for a Fed pause ring louder
Another day, another soft US inflation print. This was the big story on Thursday. After we had already seen the market react in a big way to Wednesday’s round of soft CPI data, we got to see plunging producer prices on Thursday, well below forecast.
Wake-up call
- industrial production
- UK GDP
- Yield differential
- China exports
- Oil surge
- global sentiment
- Inflation headache
- Dealers report
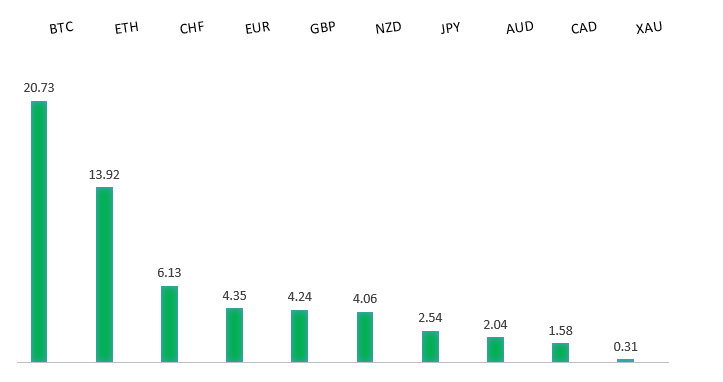
Peformance chart: 30 Day Performance vs. US dollar (%)
Suggested reading
- Getting So Much Better, But Not Enough to Stop a Rate Hike, J. Authers, Bloomberg (July 13, 2023)
- Short Selling Just Hit $1 Trillion, M. Celarier, Institutional Investor (July 11, 2023)
Chart talk: Technical & fundamental highlights
Choose pair:
EURUSD – technical overview
The Euro remains well supported on dips following a run to the topside through 1.1000 earlier this year. Any additional setbacks should be well supported ahead of 1.0500 in favor of a bullish continuation. Ultimately, only a monthly close back below 1.0500 would give reason for concern. Next key resistance comes in the form of the February 2022 high at 1.1496.EURUSD – fundamental overview
The takeaway from this week continues to be one in which the ECB is still very much in a tightening cycle, while the Fed could be on the verge of a pause. The market didn't care much about softer Eurozone industrial production, instead focusing on the bigger picture theme around interest rate expectations. Thursday's plunging US producer prices only helped to reinforce the narrative, sending the Euro to a fresh yearly high. Key standouts on Friday’s calendar come from German wholesale prices, Eurozone trade, Canada manufacturing sales, US import and export prices, and Michigan sentiment.EURUSD - Technical charts in detail
GBPUSD – technical overview
Signs have emerged of the market wanting to put in a longer-term base after collapsing to a record low in September 2022. The November 2022 monthly close back above 1.2000 strengthens this prospect. Any setbacks should now be well supported ahead of 1.2000. Next key resistance comes in at 1.3500.GBPUSD – fundamental overview
UK GDP was better than expected and US producer prices were much softer. This was all that would be needed to extend the run of fresh yearly highs in the Pound against the Buck. Key standouts on Friday’s calendar come from German wholesale prices, Eurozone trade, Canada manufacturing sales, US import and export prices, and Michigan sentiment.USDJPY – technical overview
The major pair has seen a nice recovery following the massive correction out from multi-year highs. Setbacks have finally been well supported ahead of 125.00 in the 127s thus far. At this stage, it looks like the market could be wanting to resume the bigger picture uptrend and head back towards a retest of that multi-year high from October 2022 up at 151.95. Look for any weakness to continue to be well supported ahead of 135.00 in favor of the next higher low.USDJPY – fundamental overview
There have been more calls of late for a shift in BOJ policy at the upcoming meeting, with many viewing the central bank's ultra accommodative stance as stale and needing of some tweaks that lean more hawkish. All of this happening while the US Dollar gets walloped this week on a round of soft inflation data that has increased odds of a Fed pause. And so, no surprise to see the Yen making a nice run. Key standouts on Friday’s calendar come from German wholesale prices, Eurozone trade, Canada manufacturing sales, US import and export prices, and Michigan sentiment.AUDUSD – technical overview
There are signs of the potential formation of a longer-term base following the late 2022 surge back above 0.6500. Next key resistance comes in at 0.7284. Setbacks should continue to be well supported in the 0.6500 area. Only a monthly close below 0.6500 would give reason for rethink.AUDUSD – fundamental overview
Aussie consumer inflation expectations held steady and China export data came in soft. But none of this mattered to the Australian Dollar, which was busy surging on the back of rallying commodities and equities after yet another softer than expected US inflation print. Key standouts on Friday’s calendar come from German wholesale prices, Eurozone trade, Canada manufacturing sales, US import and export prices, and Michigan sentiment.USDCAD – technical overview
Above 1.3000 signals an end to a period of longer-term bearish consolidation and suggests the market is in the process of carving out a more significant longer-term base. Next key resistance now comes in up into the 1.4000 area. Setbacks should be very well supported down into the 1.3000 area.USDCAD – fundamental overview
Another yearly high for the Canadian Dollar on Thursday, this after commodities soared, with oil gains standing out. Higher US equities and improved overall sentiment also helped to rally the Loonie after yet another soft inflation print out of the US. Key standouts on Friday’s calendar come from German wholesale prices, Eurozone trade, Canada manufacturing sales, US import and export prices, and Michigan sentiment.NZDUSD – technical overview
Overall pressure remains on the downside with the market once again stalling out on a run up into the 0.6500 area. Ultimately, a break back above 0.6577 would be required to take the immediate pressure off the downside. A monthly close below 0.6000 would intensify bearish price action.NZDUSD – fundamental overview
This week's hawkish hold from the RBNZ set the tone for an initial Kiwi rally before the currency caught fire on Wednesday and Thursday after consecutive soft inflation prints out of the US. Key standouts on Friday’s calendar come from German wholesale prices, Eurozone trade, Canada manufacturing sales, US import and export prices, and Michigan sentiment.US SPX 500 – technical overview
Longer-term technical studies are in the process of unwinding from extended readings off record highs. Look for rallies to be well capped in favor of lower tops and lower lows. A monthly close back above 4500 will be required to take the immediate pressure off the downside. Next key support comes in at 4376.US SPX 500 – fundamental overview
We've finally reached a point in the cycle where the Fed recognizes unanchored inflation expectations pose a greater downside risk than over-tightening. This is significant, as it means less investor friendly monetary policy that risks potential recession in the months ahead. Overall, we expect inflation to continue to be a problem in 2023 that results in downside pressure into rallies despite market expectations that would argue otherwise.GOLD (SPOT) – technical overview
The 2019 breakout above the 2016 high at 1375 was a significant development, opening the door for fresh record highs. Setbacks should now be well supported above 1600 on a monthly close basis ahead of the next major upside extension. The recent break back above 1808 strengthens the bullish outlook. Next major resistance comes in at 2100, above which opens the next extension towards 2,500.GOLD (SPOT) – fundamental overview
The yellow metal continues to be well supported on dips with solid demand from medium and longer-term accounts. These players are more concerned about inflation risk and a less upbeat global growth outlook. All of this should keep the commodity well supported, with many market participants also fleeing to the hard asset as the grand dichotomy of record high equities and record low yields comes to an unnerving climax.