


Today’s report: Investors feeling good into heart of holidays
Investors are getting everything they could want for Christmas. It’s the perfect Goldilocks economy. US economic data has been solid overall, though not too strong to support higher rates, all while inflation has cooled off.
Wake-up call
- De Guindos
- UK GDP a
- inflation forecast
- China stimulus
- Canada growth
- spending data
- Fed bends
- Macro themes
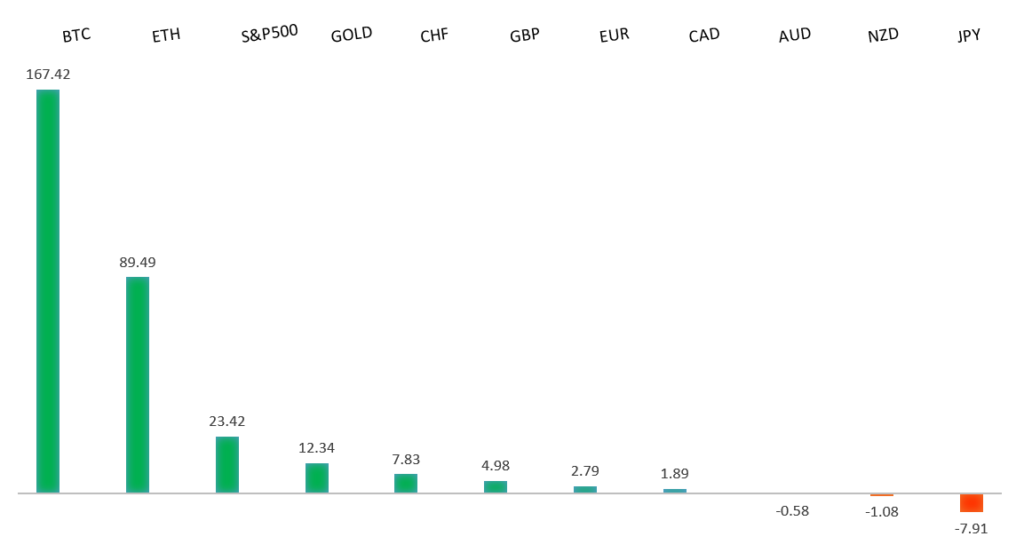
Peformance chart: YTD Performance vs. US dollar (%)
Suggested reading
- The Biggest Problem At the Fed: Total Lack Of Original Thought, RCM (December 22, 2023)
- Decarbonising Bonus from Ancient Soil Enrichment, Financial Times (December 22, 2023)
Chart talk: Technical & fundamental highlights
Choose pair:
EURUSD – technical overview
The Euro has been in a multi-month consolidation since bottoming out in 2022. Setbacks have since been exceptionally well supported on dips below 1.0500, with a higher platform sought out ahead of the next major upside extension. Look for a push through the yearly high at 1.1276 to strengthen the constructive outlook and extend the recovery run towards 1.2000. Only back below 1.0400 negates.EURUSD – fundamental overview
ECB De Guindos commented that there was a clear downturn in inflation, but it was too early to talk about an interest rate cut. Guindos stressed policy could ease once inflation is converged on 2%. Key standouts on Friday’s calendar come from German import prices, UK retail sales and GDP, Canada GDP and manufacturing sales, US durable goods, core PCE, personal income, personal spending, Michigan sentiment, and new home sales.EURUSD - Technical charts in detail
GBPUSD – technical overview
Signs have emerged of the market wanting to put in a longer-term base after collapsing to a record low in September 2022. The November 2022 monthly close back above 1.2000 strengthens this prospect. Any setbacks should now be well supported ahead of 1.2000. Next key resistance comes in at 1.2818.GBPUSD – fundamental overview
UK November PSNCR rose to GBP 12.5 billion from 11.8 billion previous, while Pubic Sector Net Borrowing fell to GBP 13.4 billion from 15.1 billion vs 13 billion forecast. November PSNB dipped to GBP 14.3 billion from 16 billion prior versus the 13 billion forecast. UK December CBI Retailing Reported Sales fell to -32 from -11, versus -14 forecast. Key standouts on Friday’s calendar come from German import prices, UK retail sales and GDP, Canada GDP and manufacturing sales, US durable goods, core PCE, personal income, personal spending, Michigan sentiment, and new home sales.USDJPY – technical overview
The market remains confined to a strong uptrend, with sights set on a retest and break of the multi-year high from 2022 at 151.95. A push through this level will open the next major upside extension towards 155.00. Key support comes in at 140.00, with only a weekly close below to delay the constructive outlook.USDJPY – fundamental overview
The Japanese government raised its inflation forecast, while Bloomberg reported Japan is expected to pass a draft budget that would reduce spending for the first time in 12 years. It seems updates like these are keeping the Yen in demand on that prospect we could see a BOJ pivot in 2024. Key standouts on Friday’s calendar come from German import prices, UK retail sales and GDP, Canada GDP and manufacturing sales, US durable goods, core PCE, personal income, personal spending, Michigan sentiment, and new home sales.AUDUSD – technical overview
There are signs of the potential formation of a longer-term base with the market trading down into a meaningful longer-term support zone. Only a monthly close below 0.6200 would give reason for rethink. Back above 0.6900 will take the big picture pressure off the downside and strengthen case for a bottom.AUDUSD – fundamental overview
The latest headlines around further China stimulus and an ongoing bid in US equities have allowed the Australian Dollar to outperform. Key standouts on Friday’s calendar come from German import prices, UK retail sales and GDP, Canada GDP and manufacturing sales, US durable goods, core PCE, personal income, personal spending, Michigan sentiment, and new home sales.USDCAD – technical overview
Above 1.3000 signals an end to a period of longer-term bearish consolidation and suggests the market is in the process of carving out a more significant longer-term base. Next key resistance now comes in up into the 1.4000 area. Setbacks should be very well supported down into the 1.3000 area.USDCAD – fundamental overview
Canada retail sales were mixed on Thursday, though with the market focused on higher oil and an ongoing bid in US equities, the Canadian Dollar was able to extend recent gains. Key standouts on Friday’s calendar come from German import prices, UK retail sales and GDP, Canada GDP and manufacturing sales, US durable goods, core PCE, personal income, personal spending, Michigan sentiment, and new home sales.NZDUSD – technical overview
Overall pressure remains on the downside with the market continuing to stall out on runs up into the 0.6500 area. At the same time, there are some signs of the market wanting to put in a longer-term base. Ultimately, a break back above 0.6500 would be required to take the medium-term pressure off the downside and encourage this prospect. A monthly close below 0.5800 will intensify bearish price action.NZDUSD – fundamental overview
The New Zealand Dollar has extended its run, getting help from a boost in monthly credit card spending, along with higher commodities and rallying US equities. Key standouts on Friday’s calendar come from German import prices, UK retail sales and GDP, Canada GDP and manufacturing sales, US durable goods, core PCE, personal income, personal spending, Michigan sentiment, and new home sales.US SPX 500 – technical overview
Longer-term technical studies continue to look quite extended, begging for a deeper correction ahead. Look for rallies to be well capped in favor of lower tops and lower lows. A monthly close back above 4800 will be required to delay the outlook. Next key support comes in at 4536.US SPX 500 – fundamental overview
The Fed has finally bent to the will of the market into year end, with the December policy decision revealing rate projections coming down from previous and more in line with what the market has been looking for. This has translated to more investor friendly policy going forward, which could now open the door for a run to fresh record highs in 2024. At the same time, we worry inflation remains a risk both the market and Fed are not taking as seriously as needed, which could once again force the Fed back into a more restrictive path and weigh heavily on stocks.GOLD (SPOT) – technical overview
The 2019 breakout above the 2016 high at 1375 was a significant development, opening the door for fresh record highs. Setbacks should now be well supported above 1900 on a monthly close basis ahead of the next major upside extension towards 2500.GOLD (SPOT) – fundamental overview
The yellow metal continues to be well supported on dips with solid demand from medium and longer-term accounts. These players are more concerned about inflation risk and a less stable and upbeat global growth outlook. All of this should keep the commodity well supported, with many market participants also fleeing to the hard asset as the grand dichotomy of record high equities and record low yields comes to an unnerving climax.