


Today’s report: The trend is your friend into year end
Trading activity is going to be exceptionally thin this week on account of the Christmas and New Year’s holidays. A large portion of market participants are off the desks and won’t be returning until next week.
Wake-up call
- ECB Schnabel
- retail sales
- pivot reality
- macro themes
- softer GDP
- risk appetite
- Fed bends
- Macro themes
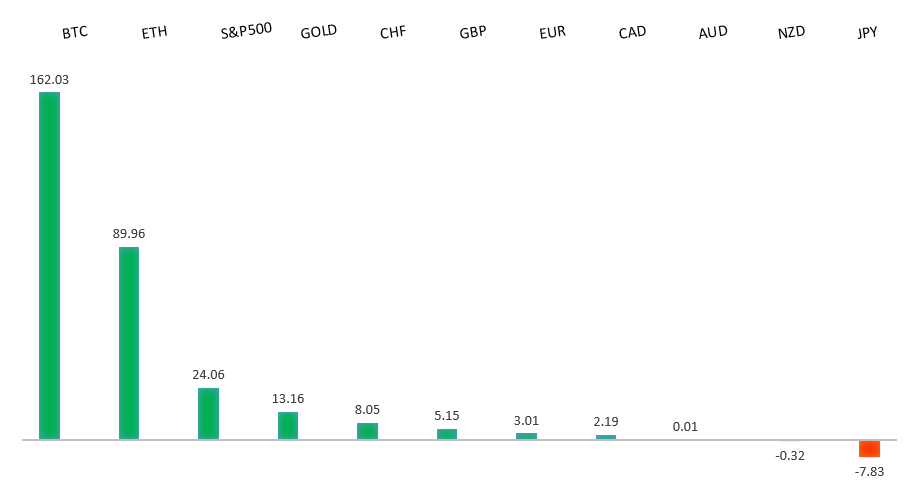
Peformance chart: YTD Performance vs. US dollar (%)
Suggested reading
- You Are Not Shohei Ohtani (Or Bobby Bonilla), E. Dellinger Fisher Investments (December 22, 2023)
- Degrowth Kills People – Yes, Literally, C. Lingle, AIER (December 19, 2023)
Chart talk: Technical & fundamental highlights
Choose pair:
EURUSD – technical overview
The Euro has been in a multi-month consolidation since bottoming out in 2022. Setbacks have since been exceptionally well supported on dips below 1.0500, with a higher platform sought out ahead of the next major upside extension. Look for a push through the yearly high at 1.1276 to strengthen the constructive outlook and extend the recovery run towards 1.2000. Only back below 1.0400 negates.EURUSD – fundamental overview
The Euro remains well supported overall on diverging central bank policy developments in December. The Fed has shifted more dovish, while the ECB has been less dovish. ECB Schnabel was out most recently cautioning the central bank still had a ways to go on inflation. Key standouts on Tuesday’s calendar come from the US Chicago Fed national activity index, S&P Case Shiller home prices, and Dallas Fed manufacturing. Trading conditions will be exceptionally thin this week on account of the Christmas-New Year's holidays.EURUSD - Technical charts in detail
GBPUSD – technical overview
Signs have emerged of the market wanting to put in a longer-term base after collapsing to a record low in September 2022. The November 2022 monthly close back above 1.2000 strengthens this prospect. Any setbacks should now be well supported ahead of 1.2000. Next key resistance comes in at 1.2818.GBPUSD – fundamental overview
The latest run of first tier UK data came in mixed, but on the whole better than expected. UK retail sales was a good deal better than forecast, while GDP was softer but not too far away from expectation. Key standouts on Tuesday’s calendar come from the US Chicago Fed national activity index, S&P Case Shiller home prices, and Dallas Fed manufacturing. Trading conditions will be exceptionally thin this week on account of the Christmas-New Year's holidays.USDJPY – technical overview
The market remains confined to a strong uptrend, with sights set on a retest and break of the multi-year high from 2022 at 151.95. A push through this level will open the next major upside extension towards 155.00. Key support comes in at 140.00, with only a weekly close below to delay the constructive outlook.USDJPY – fundamental overview
Former BOJ Masai was on the wires saying current expectations for the BOJ to pivot in early-2024 appear premature, particularly when taking into account recent BO speak and the government's view of the economy. Japan unemployment and other data came in as expected on Tuesday. Key standouts on Tuesday’s calendar come from the US Chicago Fed national activity index, S&P Case Shiller home prices, and Dallas Fed manufacturing. Trading conditions will be exceptionally thin this week on account of the Christmas-New Year's holidays.AUDUSD – technical overview
There are signs of the potential formation of a longer-term base with the market trading down into a meaningful longer-term support zone. Only a monthly close below 0.6200 would give reason for rethink. Back above 0.6900 will take the big picture pressure off the downside and strengthen case for a bottom.AUDUSD – fundamental overview
Ongoing demand for the Australian Dollar has been driven off big picture flows around the Fed pivot, higher stocks, and higher commodities. Key standouts on Tuesday’s calendar come from the US Chicago Fed national activity index, S&P Case Shiller home prices, and Dallas Fed manufacturing. Trading conditions will be exceptionally thin this week on account of the Christmas-New Year's holidays.USDCAD – technical overview
Above 1.3000 signals an end to a period of longer-term bearish consolidation and suggests the market is in the process of carving out a more significant longer-term base. Next key resistance now comes in up into the 1.4000 area. Setbacks should be very well supported down into the 1.3000 area.USDCAD – fundamental overview
The Canadian Dollar gave back its latest round of gains after Canada GDP came in below forecast. Still, the currency has been better bid in recent days on account of improved investor risk appetite, and demand for commodities. Key standouts on Tuesday’s calendar come from the US Chicago Fed national activity index, S&P Case Shiller home prices, and Dallas Fed manufacturing. Trading conditions will be exceptionally thin this week on account of the Christmas-New Year's holidays.NZDUSD – technical overview
Overall pressure remains on the downside with the market continuing to stall out on runs up into the 0.6500 area. At the same time, there are some signs of the market wanting to put in a longer-term base. Ultimately, a break back above 0.6500 would be required to take the medium-term pressure off the downside and encourage this prospect. A monthly close below 0.5800 will intensify bearish price action.NZDUSD – fundamental overview
Ongoing demand for the New Zealand Dollar has been driven off big picture flows around the Fed pivot, higher stocks, and higher commodities. Key standouts on Tuesday’s calendar come from the US Chicago Fed national activity index, S&P Case Shiller home prices, and Dallas Fed manufacturing. Trading conditions will be exceptionally thin this week on account of the Christmas-New Year's holidays.US SPX 500 – technical overview
Longer-term technical studies continue to look quite extended, begging for a deeper correction ahead. Look for rallies to be well capped in favor of lower tops and lower lows. A monthly close back above 4800 will be required to delay the outlook. Next key support comes in at 4536.US SPX 500 – fundamental overview
The Fed has finally bent to the will of the market into year end, with the December policy decision revealing rate projections coming down from previous and more in line with what the market has been looking for. This has translated to more investor friendly policy going forward, which could now open the door for a run to fresh record highs in 2024. At the same time, we worry inflation remains a risk both the market and Fed are not taking as seriously as needed, which could once again force the Fed back into a more restrictive path and weigh heavily on stocks.GOLD (SPOT) – technical overview
The 2019 breakout above the 2016 high at 1375 was a significant development, opening the door for fresh record highs. Setbacks should now be well supported above 1900 on a monthly close basis ahead of the next major upside extension towards 2500.GOLD (SPOT) – fundamental overview
The yellow metal continues to be well supported on dips with solid demand from medium and longer-term accounts. These players are more concerned about inflation risk and a less stable and upbeat global growth outlook. All of this should keep the commodity well supported, with many market participants also fleeing to the hard asset as the grand dichotomy of record high equities and record low yields comes to an unnerving climax.