


Next 24 hours: Pound and New Zealand Dollar stand out
Today’s report: RBNZ holds, UK inflation, Fed Minutes ahead
We expect activity will be picking up today with some major first tier calendar risk on the docket. At the moment, we’re seeing very tight ranges this week as currencies consolidate recent gains against the US Dollar and US equities consolidate just off record high levels.
Wake-up call
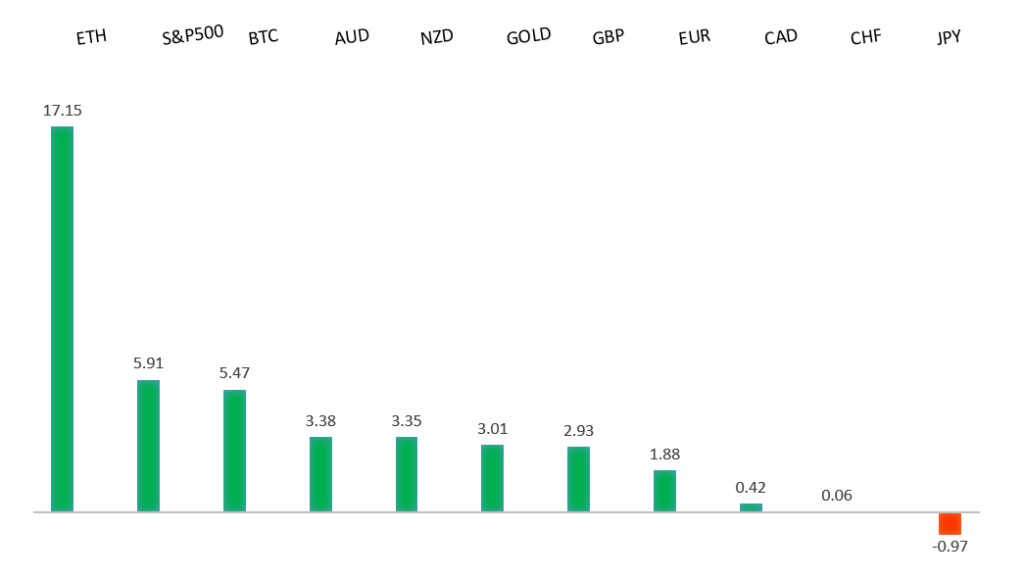
Peformance chart: 30-Day Performance vs. US dollar (%)
Suggested reading
- Were Inflation Reports Important, or Accurate?, J. Calhoun, Alhambra (May 19, 2024)
- The Fed Still Isn't Monetizing the Debt, C. Roche, Discipline Funds (May 20, 2024)
Chart talk: Technical & fundamental highlights
Choose pair:
EURUSD – technical overview
The Euro has been in a multi-month consolidation since bottoming out in 2022. Setbacks have since been exceptionally well supported on dips below 1.0500, with a higher platform sought out ahead of the next major upside extension. Look for a push through the 2023 high at 1.1276 to strengthen the constructive outlook and extend the recovery run towards 1.2000. Only back below 1.0400 negates.EURUSD – fundamental overview
The Euro wasn't able to do much on Tuesday after taking in a German producer prices miss and a Eurozone trade surplus number that fell short of expectation. Key standouts on Wednesday’s calendar come from UK inflation, an ECB Lagarde speech, US existing home sales, and the Fed Minutes.EURUSD - Technical charts in detail
GBPUSD – technical overview
Signs have emerged of the market wanting to put in a longer-term base after collapsing to a record low in September 2022. The latest push to a fresh 2024 high beyond 1.2830 confirms the outlook and opens the door for the next major upside extension towards the 2023 high at 1.3143. Any setbacks should now be well supported ahead of 1.2000.GBPUSD – fundamental overview
Activity is expected to pick up on Wednesday as the market takes in the latest round of inflation data in the UK. There has been a little more attention around today's numbers with the BOE expecting the data to show headline CPI has already fallen near objective on account of a drop in regulated energy prices. Other key standouts on today's calendar include an ECB Lagarde speech, US existing home sales, and the Fed Minutes.USDJPY – technical overview
The market remains confined to a strong uptrend, most recently extending to a multi-year high through 160.00. Key support comes in at 151.95, with only a weekly close below to delay the constructive outlook.USDJPY – fundamental overview
Japan trade data was out earlier today and overall, produced a deeper than expected deficit. As far as price action goes, it's been more of the same Yen selling in the absence of any fresh jawboning from the Ministry of Finance or Bank of Japan. Key standouts on Wednesday’s calendar come from UK inflation, an ECB Lagarde speech, US existing home sales, and the Fed Minutes.AUDUSD – technical overview
There are signs of the potential formation of a longer-term base with the market trading down into a meaningful longer-term support zone. Only a monthly close below 0.6200 would give reason for rethink. Back above 0.6900 will take the big picture pressure off the downside and strengthen case for a bottom.AUDUSD – fundamental overview
The Australian Dollar hasn't done much in a quiet Wednesday session lacking in first tier data. The tight ranges in markets have also kept things quiet for the Australian Dollar. We did however see some mild demand on the back of the more hawkish than expected RBNZ decision. Key standouts on Wednesday’s calendar come from UK inflation, an ECB Lagarde speech, US existing home sales, and the Fed Minutes.USDCAD – technical overview
Above 1.3000 signals an end to a period of longer-term bearish consolidation and suggests the market is in the process of carving out a more significant longer-term base. Next key resistance now comes in up into the 1.4000 area. Setbacks should be very well supported down into the 1.3000 area.USDCAD – fundamental overview
The Canadian Dollar has been an underperformer of late and got another dose of this on Tuesday after Canada inflation data came in softer than expected. Market odds for a June Bank of Canada rate cut have risen well back above 50% after sitting down near 40% a week ago. Key standouts on Wednesday’s calendar come from UK inflation, an ECB Lagarde speech, US existing home sales, and the Fed Minutes.NZDUSD – technical overview
Overall pressure remains on the downside with the market continuing to stall out on runs up into the 0.6500 area. At the same time, there are some signs of the market wanting to put in a longer-term base. Ultimately, a break back above 0.6500 would be required to take the medium-term pressure off the downside and encourage this prospect. A monthly close below 0.5800 will intensify bearish price action.NZDUSD – fundamental overview
The New Zealand Dollar has been better bid on Wednesday after the RBNZ left rates on hold but delivered a more hawkish leaning communication than expected. The door was even left open to the possibility of rate hikes, with the central bank still not as comfortable with inflation coming back down on the schedule it would have liked to have seen. Key standouts on Wednesday’s calendar come from UK inflation, an ECB Lagarde speech, US existing home sales, and the Fed Minutes.US SPX 500 – technical overview
Longer-term technical studies continue to look quite extended, begging for a deeper correction ahead. At the same time, the latest bullish breakout to a fresh record high beyond the 2024 high opens the door for the next measured move upside extension targeting the 5650 area. Key support comes in at 4928.US SPX 500 – fundamental overview
Though we have seen a healthy adjustment of investor expectations towards the amount of rate cuts in 2024, the market still hopes policy will end up erring more towards the investor friendly, accommodative side of things. This bet has kept stocks well bid into dips and consistently pushing record highs.GOLD (SPOT) – technical overview
The 2019 breakout above the 2016 high at 1375 was a significant development, opening the door for fresh record highs and this next major upside extension into the 2500-3000 area. Setbacks should now be well supported above 2000 on a monthly close basis.GOLD (SPOT) – fundamental overview
The yellow metal has pushed record highs in 2024 with solid demand from medium and longer-term accounts. These players are more concerned about inflation, geopolitical risk and a less upbeat global growth outlook. All of this should keep the commodity well supported, with many market participants also fleeing to the hard asset as the grand dichotomy of record high equities and record low yields comes to an end.