


Today’s report: Pendulum swings back to hawkish Fed pricing
The big story in the second half of the week has been a run of US calendar events that have fueled a hawkish repricing of Fed rate cut bets. The combination of the hawkish Fed Minutes, stronger jobless claims data, and robust PMIs have all resulted in the market getting back to pricing closer to just one full rate cut in 2024.
Wake-up call
- solid PMIs
- expansion territory
- Japan CPI
- Heavy setbacks
- Oil weakness
- consumer spending
- US CPI
- Macro themes
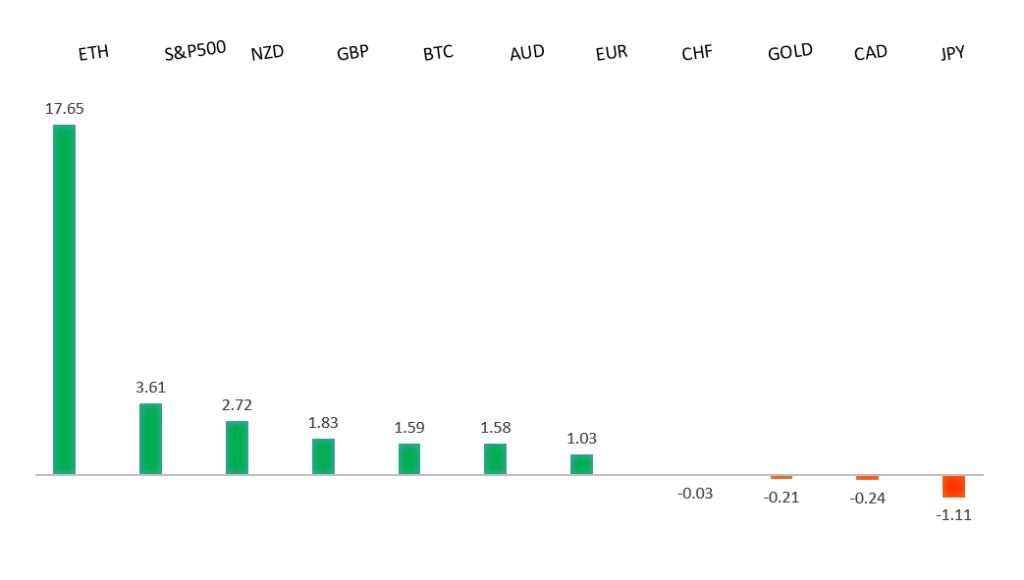
Peformance chart: 30-Day Performance vs. US dollar (%)
Suggested reading
- British Bull Will Resume After Rishi Sunak Wiggles, Fisher Investments (May 22, 2024)
- Permabears and Permabulls Are Both Dangerous, M. Harris, Price Action Lab (May 22, 2024)
Chart talk: Technical & fundamental highlights
Choose pair:
EURUSD – technical overview
The Euro has been in a multi-month consolidation since bottoming out in 2022. Setbacks have since been exceptionally well supported on dips below 1.0500, with a higher platform sought out ahead of the next major upside extension. Look for a push through the 2023 high at 1.1276 to strengthen the constructive outlook and extend the recovery run towards 1.2000. Only back below 1.0400 negates.EURUSD – fundamental overview
The Euro tried to find a bottom after Eurozone, French, and German PMIs all came in better than expected. However, the subsequent round of strong US economic data in the form of initial jobless claims and PMI reads was too much to ignore, forcing a hawkish repricing of Fed rate cut bets and broad based Dollar demand. Key standouts on Friday’s calendar come from German GDP, UK retail sales, Canada retail sales, US durable goods, and Michigan sentiment.EURUSD - Technical charts in detail
GBPUSD – technical overview
Signs have emerged of the market wanting to put in a longer-term base after collapsing to a record low in September 2022. The latest push to a fresh 2024 high beyond 1.2830 confirms the outlook and opens the door for the next major upside extension towards the 2023 high at 1.3143. Any setbacks should now be well supported ahead of 1.2000.GBPUSD – fundamental overview
UK manufacturing PMIs returned to expansion territory and put in their best showing since July 2022. The Pound has been supported on the data and on the BOE's (usual practice of) cancelling all public statements until after the July general election. This will significantly reduce odds for any rate cuts at the June meeting. Key standouts on Friday’s calendar come from German GDP, UK retail sales, Canada retail sales, US durable goods, and Michigan sentiment.USDJPY – technical overview
The market remains confined to a strong uptrend, most recently extending to a multi-year high through 160.00. Key support comes in at 151.95, with only a weekly close below to delay the constructive outlook.USDJPY – fundamental overview
Indeed, Japan inflation data came in a little above forecast. However, the fact that the CPI reads were a good deal lower than previous was where the focus was, with more Yen selling seen in the aftermath. The new line in the sand appears to be around 160.00 as far as official response goes. It will be interesting to keep an eye on that level over the coming days. Key standouts on Friday’s calendar come from German GDP, UK retail sales, Canada retail sales, US durable goods, and Michigan sentiment.AUDUSD – technical overview
There are signs of the potential formation of a longer-term base with the market trading down into a meaningful longer-term support zone. Only a monthly close below 0.6200 would give reason for rethink. Back above 0.6900 will take the big picture pressure off the downside and strengthen case for a bottom.AUDUSD – fundamental overview
The Australian Dollar has been struggling into the end of the week on the combination of stronger US economic data and heavy downside pressure in the price of gold. Key standouts on Friday’s calendar come from German GDP, UK retail sales, Canada retail sales, US durable goods, and Michigan sentiment.USDCAD – technical overview
Above 1.3000 signals an end to a period of longer-term bearish consolidation and suggests the market is in the process of carving out a more significant longer-term base. Next key resistance now comes in up into the 1.4000 area. Setbacks should be very well supported down into the 1.3000 area.USDCAD – fundamental overview
Oil prices have slumped to their lowest level since February, and the price of gold has taken a turn for the worse. Both of these developments have opened more downside pressure on a Canadian Dollar that has already been struggling with a softer recent run of economic data. Key standouts on Friday’s calendar come from German GDP, UK retail sales, Canada retail sales, US durable goods, and Michigan sentiment.NZDUSD – technical overview
Overall pressure remains on the downside with the market continuing to stall out on runs up into the 0.6500 area. At the same time, there are some signs of the market wanting to put in a longer-term base. Ultimately, a break back above 0.6500 would be required to take the medium-term pressure off the downside and encourage this prospect. A monthly close below 0.5800 will intensify bearish price action.NZDUSD – fundamental overview
New Zealand retail card spending reports show a slowing in consumer spending over the coming months which does not bode well for the New Zealand economy. The New Zealand Dollar has stalled out for now, perhaps with the consumer spending update weighing a bit, and perhaps because of the latest run of risk off flow in the aftermath of a strong round of economic data out of the US that had the market repricing Fed rate cut bets to just one in 2024. Key standouts on Friday’s calendar come from German GDP, UK retail sales, Canada retail sales, US durable goods, and Michigan sentiment.US SPX 500 – technical overview
Longer-term technical studies continue to look quite extended, begging for a deeper correction ahead. At the same time, the latest bullish breakout to a fresh record high beyond the 2024 high opens the door for the next measured move upside extension targeting the 5650 area. Key support comes in at 4928.US SPX 500 – fundamental overview
Though we have seen a healthy adjustment of investor expectations towards the amount of rate cuts in 2024, the market still hopes policy will end up erring more towards the investor friendly, accommodative side of things. This bet has kept stocks well bid into dips and consistently pushing record highs.GOLD (SPOT) – technical overview
The 2019 breakout above the 2016 high at 1375 was a significant development, opening the door for fresh record highs and this next major upside extension into the 2500-3000 area. Setbacks should now be well supported above 2000 on a monthly close basis.GOLD (SPOT) – fundamental overview
The yellow metal has pushed record highs in 2024 with solid demand from medium and longer-term accounts. These players are more concerned about inflation, geopolitical risk and a less upbeat global growth outlook. All of this should keep the commodity well supported, with many market participants also fleeing to the hard asset as the grand dichotomy of record high equities and record low yields comes to an end.