


Next 24 hours: Quiet consolidation ahead of US presidential debate
Today’s report: Euro underperforms on data drag
We’re back to seeing some Dollar selling and demand for stocks after things had gone south at the end of last week. Stocks were already happy to bid back up on Monday, before the US Dollar finally relented later in the day.
Wake-up call
- investor confidence
- employment data
- BOJ pricing
- bad data
- BoC Macklem
- bigger picture
- accommodative policy
- Macro themes
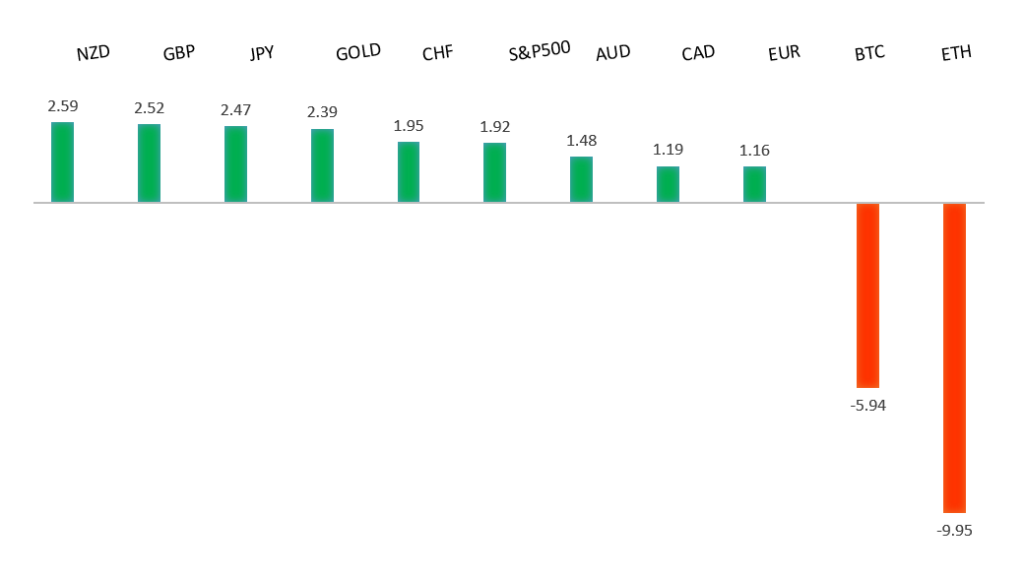
Peformance chart: 30-Day Performance vs. US dollar (%)
Suggested reading
- Tax Crypto As Money, Not Property, G. Dwyer, AIER (September 6, 2024)
- It Would Be Perfectly Normal If Stocks Were Weak Now, S. McBride, RiskHedge (September 6, 2024)
Chart talk: Technical & fundamental highlights
Choose pair:
EURUSD – technical overview
The Euro has been in a multi-month consolidation since bottoming out in 2022. Setbacks have since been exceptionally well supported on dips below 1.0500, with a higher platform sought out ahead of the next major upside extension. Look for a push through the 2023 high at 1.1276 to strengthen the constructive outlook and extend the recovery run towards 1.2000. Only back below 1.0400 negates.EURUSD – fundamental overview
Investor confidence in the Eurozone declined for a third month and traders are now nervous the ECB could signal deeper cuts later this week. 63 basis points of cuts are currently priced between now and year end. Key standouts on Tuesday’s calendar come from German inflation, UK employment, US NFIB business optimism, and a speech from Bank of Canada Macklem.EURUSD - Technical charts in detail
GBPUSD – technical overview
Signs have emerged of the market wanting to put in a longer-term base after collapsing to a record low in September 2022. The door is now open for the next major upside extension towards the 2018 high at 1.4377. Any setbacks should be well supported ahead of 1.2500.GBPUSD – fundamental overview
The Pound has come under some more pressure of late as traders discount the possibility for deeper BOE cuts on the weakening global macro picture. The local rate market is now pricing two full rate cuts between now and year end, up from 40 bps a week ago. Key standouts on Tuesday’s calendar come from German inflation, UK employment, US NFIB business optimism, and a speech from Bank of Canada Macklem.USDJPY – technical overview
The market has entered a period of correction after extending the uptrend to a multi-year high through 160.00. Critical support comes in around 140.00, with only a monthly close below the barrier to compromise the bullish outlook. A higher low is ideally sought out above 140.00 in favor of a bullish continuation.USDJPY – fundamental overview
The Yen has remained bid overall on expectations the BOJ will go ahead with another rate hike in Q4. Remember, BOJ Ueda already alluded to the fact that the central bank will be ready to hike rates again if conditions are met. Key standouts on Tuesday’s calendar come from German inflation, UK employment, US NFIB business optimism, and a speech from Bank of Canada Macklem.AUDUSD – technical overview
There are signs of the potential formation of a longer-term base with the market trading down into a meaningful longer-term support zone. Only a monthly close below 0.6200 would give reason for rethink. Back above 0.6900 will take the big picture pressure off the downside and strengthen case for a bottom.AUDUSD – fundamental overview
The Australian Dollar is doing good job finding bids into dips on the back of a softer round of economic data out of Australia and China. Australia consumer confidence and business confidence reads were disappointing, while China trade also let the market down. Key standouts on Tuesday’s calendar come from German inflation, UK employment, US NFIB business optimism, and a speech from Bank of Canada Macklem.USDCAD – technical overview
A sustained hold above 1.3000 over the past several months signals an end to a period of longer-term bearish consolidation and suggests the market is in the process of carving out a more significant longer-term base. Next key resistance now comes in up into the 1.4000 area, with a break to open a retest of the 2020 high just ahead of 1.4700. Setbacks should be very well supported down into the 1.3000 area.USDCAD – fundamental overview
The latest run of Canadian Dollar weakness should come as no surprise after Canada unemployment ticked up, Ivey PMIs were ugly, and oil remains under pressure. Key standouts on Tuesday’s calendar come from German inflation, UK employment, US NFIB business optimism, and a speech from Bank of Canada Macklem.NZDUSD – technical overview
Overall pressure remains on the downside with the market continuing to stall out on runs up into the 0.6500 area. At the same time, there are some signs of the market wanting to put in a longer-term base. Ultimately, a break back above 0.6500 would be required to take the medium-term pressure off the downside and encourage this prospect. A monthly close below 0.5800 will intensify bearish price action.NZDUSD – fundamental overview
Absence of first tier data out of New Zealand has left the currency trading off bigger picture themes and flows. A recent recovery in risk sentiment and some renewed Dollar selling are factoring into the Tuesday demand. Key standouts on Tuesday’s calendar come from German inflation, UK employment, US NFIB business optimism, and a speech from Bank of Canada Macklem.US SPX 500 – technical overview
The longer term uptrend remains intact and dips continue to be exceptionally well supported. Critical support comes in at 5093, with only a break back below this level to compromise the structure and open the door for a more significant corrective decline. Until then, the focus remains on a retest and break back above the record high.US SPX 500 – fundamental overview
The US equities market remains exceptionally well supported in 2024 on the back of an ongoing expectation for more rate cuts than less going forward. Investors are feeling better about a soft landing in the US economy and this has also been accompanied by an accommodative adjustment of Fed policy. It will however be important to keep an eye on inflation, bigger picture economic data and geopolitical risk in the months ahead.GOLD (SPOT) – technical overview
The 2019 breakout above the 2016 high at 1375 was a significant development, opening the door for fresh record highs and this next major upside extension into the 2500-3000 area. Setbacks should now be well supported above 2300 on a monthly close basis.GOLD (SPOT) – fundamental overview
The yellow metal has pushed record highs in 2024 with solid demand from medium and longer-term accounts. These players are more concerned about inflation, geopolitical risk and a less upbeat global growth outlook. All of this should keep the commodity well supported over the coming months.