


 | ||
| 7th May 2025 | view in browser | ||
| US stock futures surge on Trump tariff shift | ||
| The US Dollar is holding steady as the day gets going, while U.S. equity futures are on the rise, buoyed by President Trump’s shift toward prescribing tariff levels and trade concessions to avoid higher duties, signaling a departure from prolonged negotiations. | ||
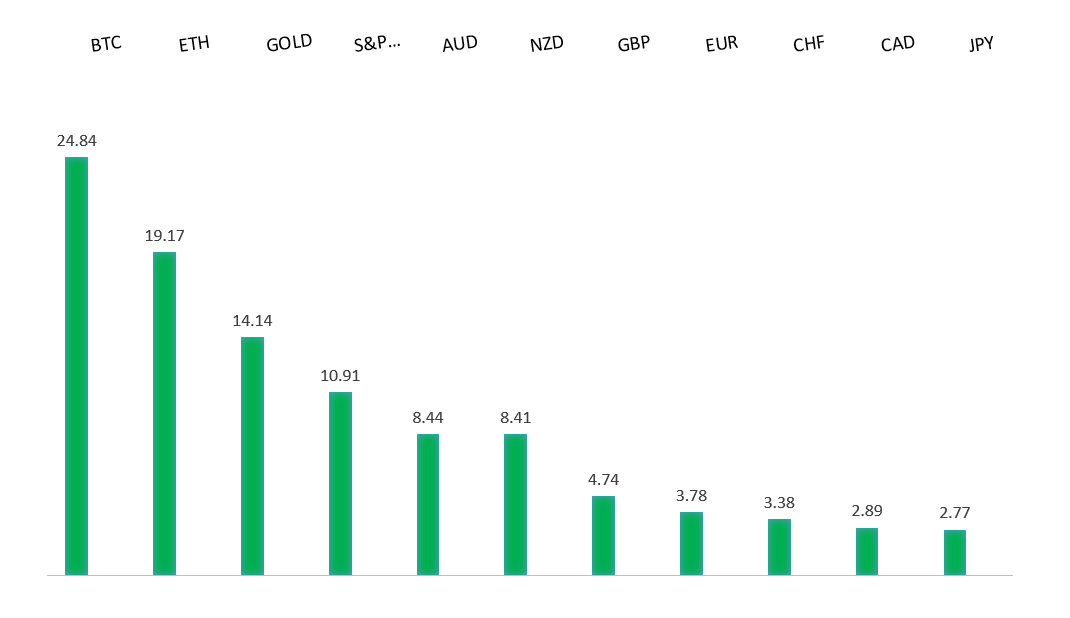
| Performance chart 30day v. USD (%) | ||
 | ||
| Technical & fundamental highlights | ||
| EURUSD: technical overview | ||
| The Euro has finally broken out from a multi-month consolidation off a critical longer-term low. This latest push through the 2023 high lends further support to the case for a meaningful bottom, setting the stage for a bullish structural shift and the next major upside extension targeting the 2021 high at 1.2350. Setbacks should be exceptionally well supported below 1.1000. | ||
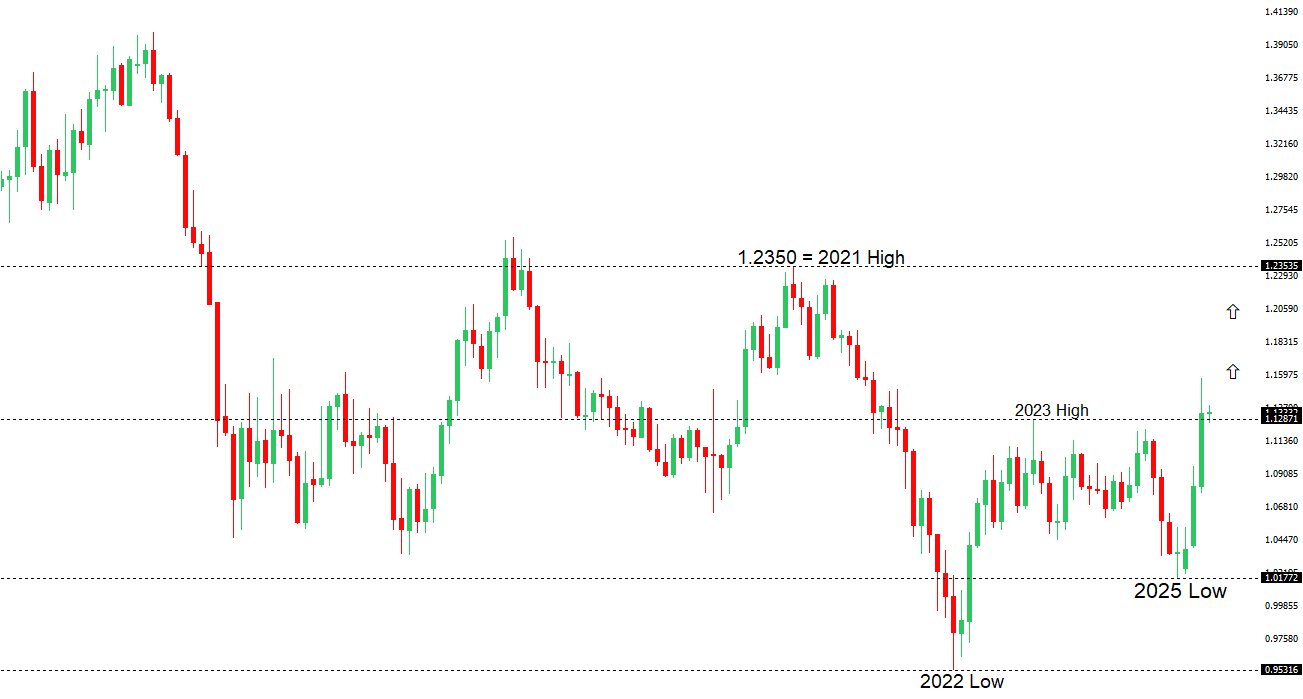 | ||
| R1 1.1574 - 21 April/2025 high - Strong R1 1.1426 - 28 April high - Medium S1 1.1266 - 1 May low - Medium S2 1.1148 - 3 April high - Strong | ||
| EURUSD: fundamental overview | ||
| Friedrich Merz, after a surprising initial defeat in the first round of voting was elected Chancellor in a second round, though the earlier setback hints at coalition fractures that may challenge his policy mandate. The Euro remains stable, buoyed by a broader dollar unwind in Asian markets, with the Bloomberg Asia Dollar Index trending upward since April, potentially driving reserve flows to the Euro. Meanwhile, the EU braces for heightened trade tensions as Trump’s investigations may increase US tariffs on €549 billion of EU goods, up by €170 billion, even as transatlantic levy negotiations continue. Economic indicators loom, with Eurozone March retail sales expected to decline amid cautious consumer sentiment, trade disputes, and stubborn services inflation, while Germany’s March factory orders and April HCOB Construction PMI signal gradual stabilization, supported by debt brake reforms and anticipated infrastructure spending. | ||
| USDJPY: technical overview | ||
| There are signs of a meaningful top in place after the market put in a multi-year high in 2024. At this point, the door is now open for a deeper setback below the 2024 low at 139.58 over the coming sessions exposing a retest of the 2023 low. Rallies should be well capped below 150.00. | ||
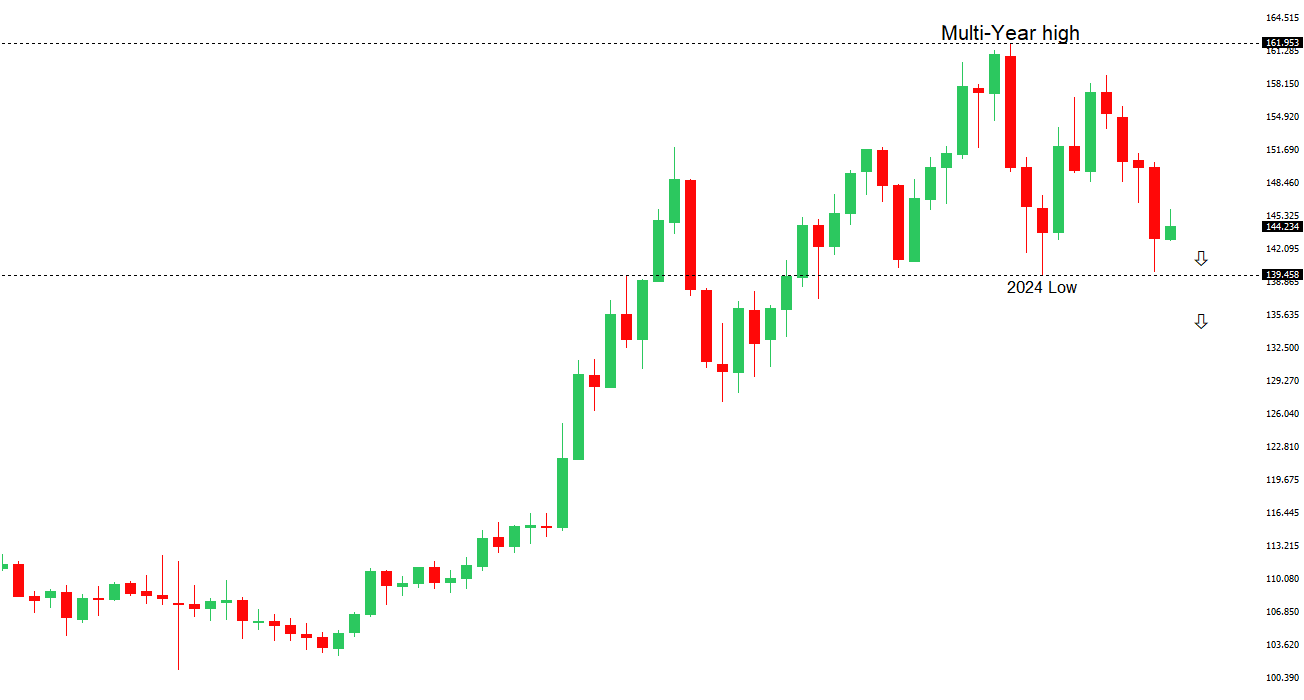 | ||
| R2 148.28 - 9 April high - Strong R1 145.93 - 2 May high - Medium S1 142.35 - 6 May low - Medium S1 141.97 - 29 April low - Medium | ||
| USDJPY: fundamental overview | ||
| USDJPY marked its third consecutive decline as Asian currencies, led by an undervalued Chinese Yuan, strengthen against the dollar, fueling speculation of a broader currency appreciation tied to a potential trade accord. The Bank of Japan, grappling with global trade uncertainties, delayed its 2% inflation target, slashed growth forecasts to 0.5%, and pushed back rate hike expectations, though Governor Ueda clarified that this delay doesn’t preclude future hikes, with Bloomberg Economics anticipating a BOJ rate increase to 1.25% by next year. Meanwhile, U.S.-Japan trade talks falter as the U.S. rejects Japan’s full tariff exemption, offering only to negotiate a reduction in the 14% Japan-specific tariff, raising concerns about broader market turbulence if the U.S. takes a hardline stance with allies. On the data front, April’s finalized PMI Composite and Services PMI were slightly revised upward to 51.2 and 52.4, respectively, while markets await the FOMC meeting and Fed Chair Powell’s guidance, with U.S. OIS markets pricing in 79 basis points of rate cuts for 2025. | ||
| AUDUSD: technical overview | ||
| There are signs of the potential formation of a longer-term base with the market trading down into a meaningful longer-term support zone. Only a monthly close below 0.5500 would give reason for rethink. A monthly close back above 0.7000 will take the big picture pressure off the downside and strengthen case for a bottom. | ||
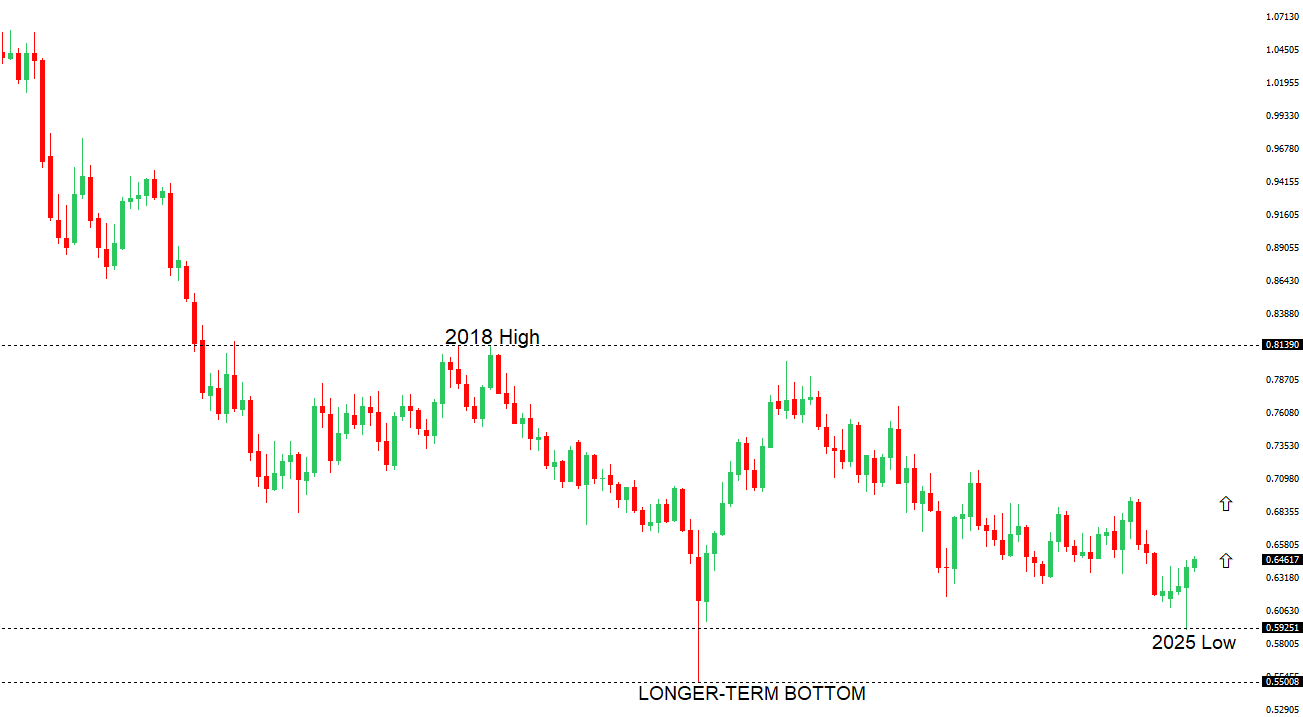 | ||
| R2 0.6550 - 25 November high - Strong R1 0.6515 - 7 May/2025 high - Medium S1 0.6344 - 24 April low - Medium S1 0.6275 - 14 April low - Strong | ||
| AUDUSD: fundamental overview | ||
| The Australian dollar rose following news of thawing trade tensions between its key partners, the U.S. and China, as Treasury Secretary Bessent and trade hawk Jamieson Greer prepare to negotiate with China’s Vice Premier He Lifeng in Switzerland, though outcomes remain uncertain. China’s recent measures, including cuts to its policy rate and reserve ratio, alongside a strengthening Yuan breaching its 200-day moving average, further bolstered the antipodeans, with the Australian dollar gaining as a Yuan proxy amid talks of Asian currency appreciation for trade deals. Meanwhile, markets eye the upcoming Fed meeting, where solid payrolls and ISM Services data may lead Powell to maintain rates despite Trump’s pressure, though tariff-related economic risks and a potential peak in U.S. data—evidenced by expected declines in sectors like leisure, trade, and construction—could eventually push the Fed toward rate cuts, potentially weakening the dollar further. | ||
| Suggested reading | ||
| Trump’s Dollar Grievances Eerily Echo Nixon’s, J. Calhoun, Alhambra (May 4, 2025) Macroeconomists Despise Macroeconomics, J. Tamny, RCM (May 6, 2025) | ||