


 | ||
| 9th May 2025 | view in browser | ||
| Risk-on mood grows as trade deals take shape | ||
| Markets have been supported by Thursday’s tariff-related developments, particularly the U.S.-UK trade framework announcement, which sparked risk-on sentiment and reduced demand for safe-haven assets. | ||
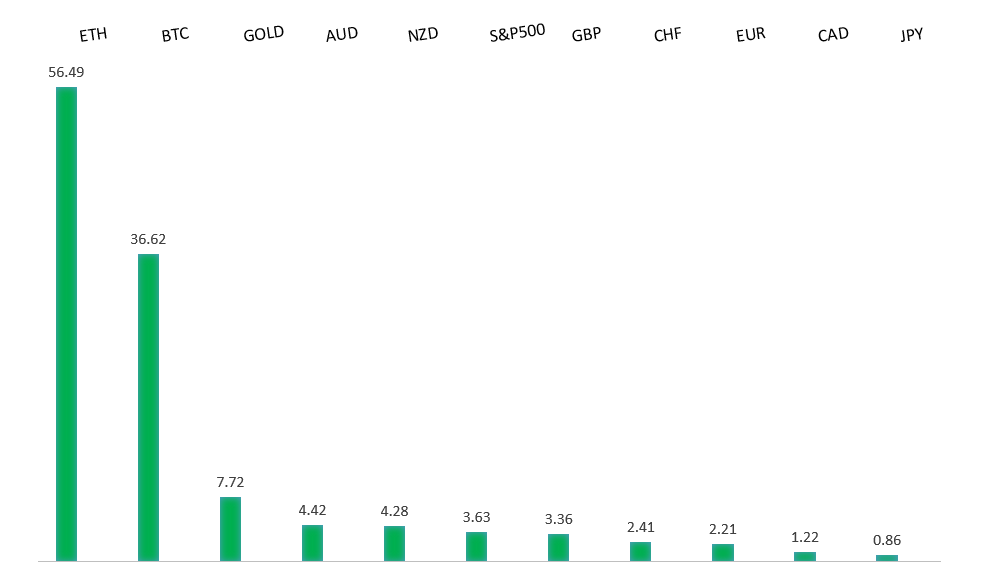
| Performance chart 30day v. USD (%) | ||
 | ||
| Technical & fundamental highlights | ||
| EURUSD: technical overview | ||
| The Euro has finally broken out from a multi-month consolidation off a critical longer-term low. This latest push through the 2023 high lends further support to the case for a meaningful bottom, setting the stage for a bullish structural shift and the next major upside extension targeting the 2021 high at 1.2350. Setbacks should be exceptionally well supported below 1.1000. | ||
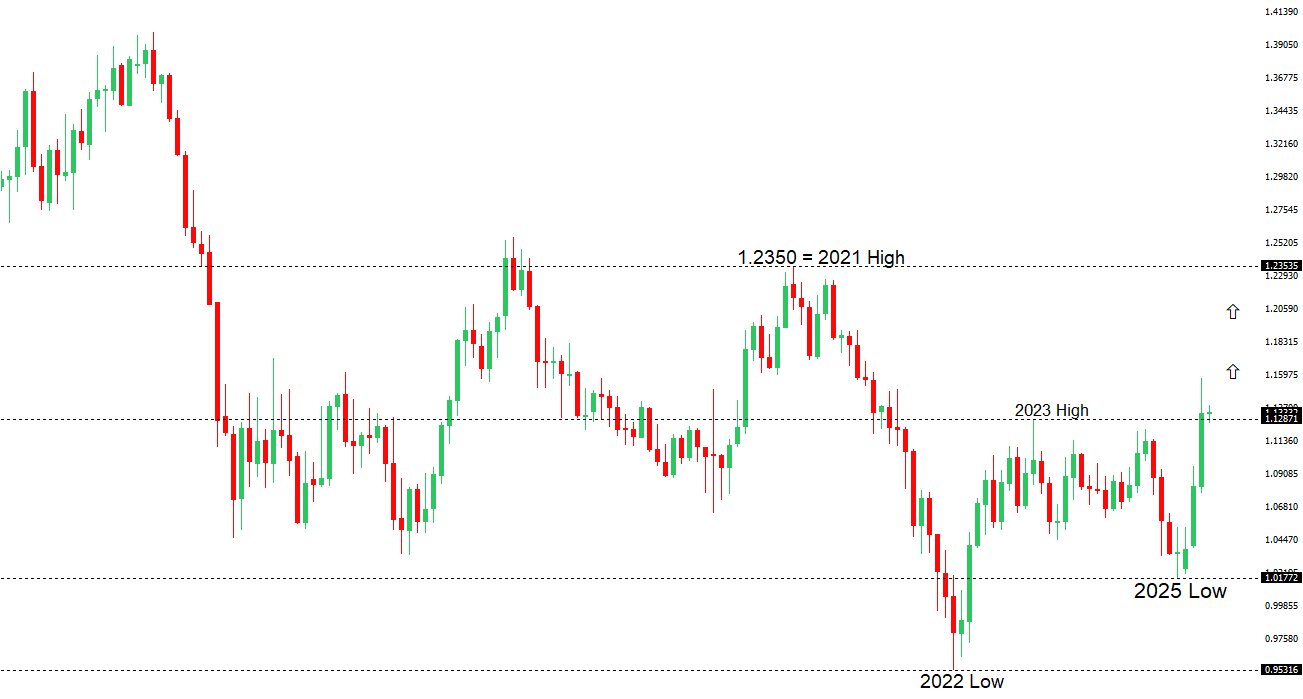 | ||
| R1 1.1574 - 21 April/2025 high - Strong R1 1.1382 - 2 May high - Medium S1 1.1181 - 11 April low - Medium S2 1.1148 - 3 April high - Strong | ||
| EURUSD: fundamental overview | ||
| Germany’s industrial production surged in March, rising 3% against a forecast of 0.8%, buoyed by strong factory orders and gains across sectors, especially autos. However, analysts caution looming U.S. tariffs and structural challenges may temper a sustained manufacturing recovery. Globally, markets are easing from a “Sell America” stance, with the dollar regaining ground against G10 and Asian currencies, though this is seen as a pause in a broader shift away from U.S. assets. Ray Dalio notes nations are forging alternative trade and geopolitical plans to reduce U.S. reliance, a trend reinforced by moves like the ASEAN+3 push for inter-regional trade and the UK-India trade deal. These developments, alongside potential dollar hedging by Asian nations, could weaken the dollar’s dominance over time, boosting demand for the euro and other major assets. Meanwhile, the ECB faces sobering warnings of Russian military risks, with experts urging Europe to accelerate its defense and fiscal spending plans within a four-to-five-year window. | ||
| USDJPY: technical overview | ||
| There are signs of a meaningful top in place after the market put in a multi-year high in 2024. At this point, the door is now open for a deeper setback below the 2024 low at 139.58 over the coming sessions exposing a retest of the 2023 low. Rallies should be well capped below 150.00. | ||
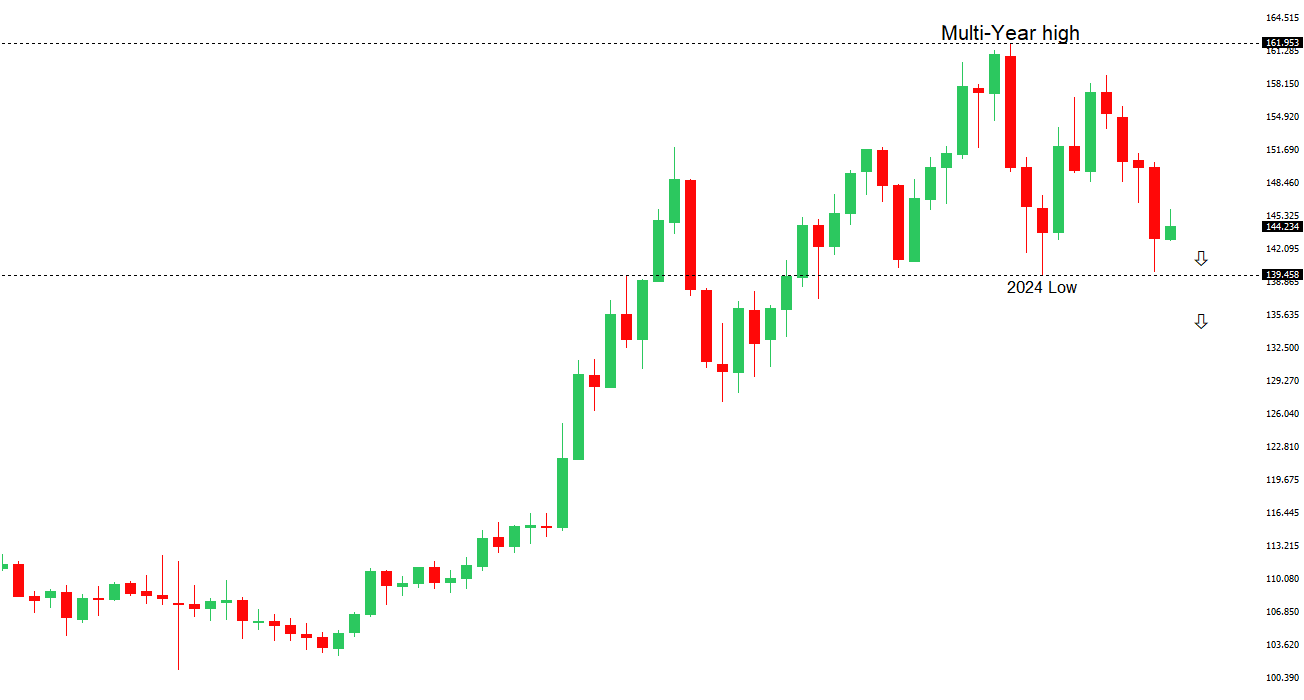 | ||
| R2 148.28 - 9 April high - Strong R1 146.19 - 9 May high - Medium S1 142.35 - 6 May low - Medium S1 141.97 - 29 April low - Medium | ||
| USDJPY: fundamental overview | ||
| Market optimism surged as risk-on sentiment took hold, fueled by Trump’s announcement of a US-UK trade framework, sparking hopes of more deals to come and prompting a retreat from haven bets. In Japan, March wage data showed nominal cash earnings rising 2.1% year-on-year, below the forecasted 2.5%, while real wages fell 2.1%, worse than expected, reinforcing the Bank of Japan’s cautious stance on rate hikes amid U.S. tariff uncertainties. The BOJ’s March meeting minutes revealed a divided board, with some members urging caution due to potential tariff-related economic risks, while others emphasized the need for nimble or decisive action, highlighting a lack of consensus on the timing of the next rate hike. Governor Ueda reiterated the BOJ will raise rates if economic projections hold, with inflation pressures remaining elevated. Japan’s trade talks with the U.S. are critical, but recent reports indicate the U.S. rejected Japan’s bid for a full tariff exemption, offering only to negotiate a reduction in the 14% Japan-specific tariff. Intensive talks are set for mid-May, with a possible leaders’ meeting at the G7 summit in June. The BOJ will release a summary of its April 30-May 1 meeting opinions on May 13. | ||
| AUDUSD: technical overview | ||
| There are signs of the potential formation of a longer-term base with the market trading down into a meaningful longer-term support zone. Only a monthly close below 0.5500 would give reason for rethink. A monthly close back above 0.7000 will take the big picture pressure off the downside and strengthen case for a bottom. | ||
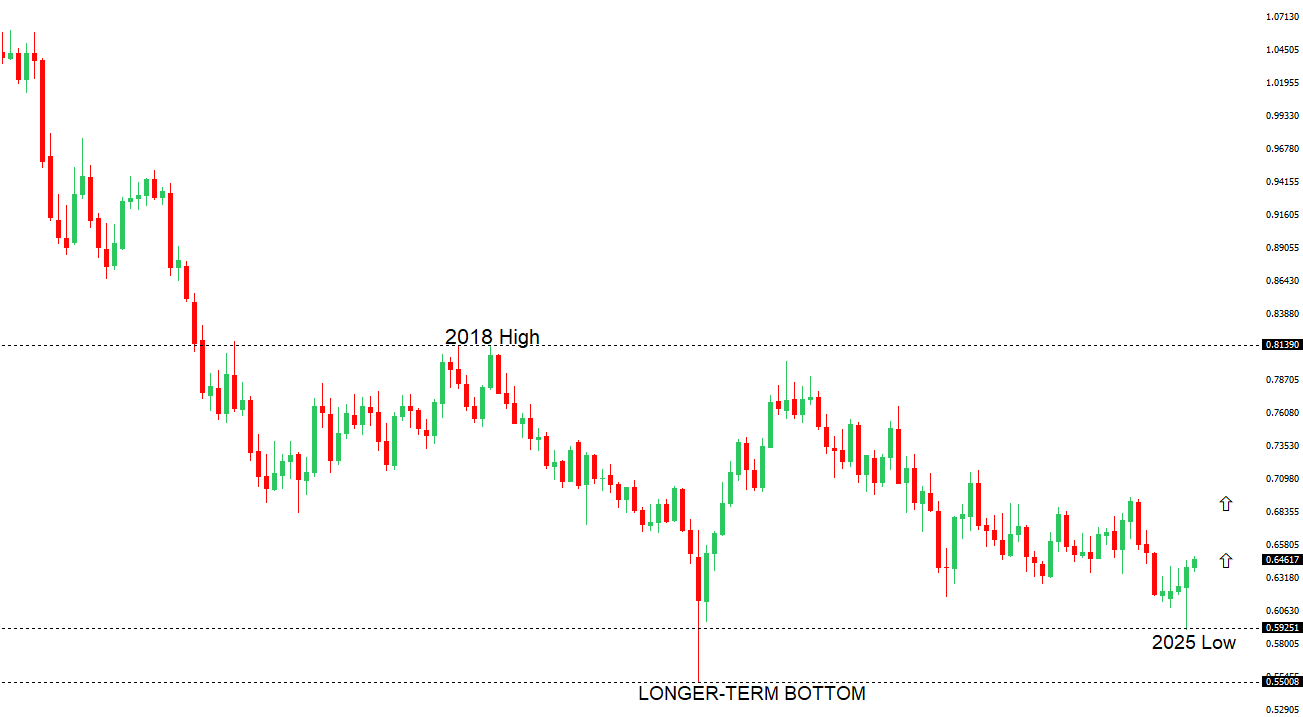 | ||
| R2 0.6550 - 25 November high - Strong R1 0.6515 - 7 May/2025 high - Medium S1 0.6344 - 24 April low - Medium S1 0.6275 - 14 April low - Strong | ||
| AUDUSD: fundamental overview | ||
| Australian dollar investors are closely watching the upcoming US-China trade talks in Switzerland, where Treasury Secretary Scott Bessent and China hawk Jamieson Greer will meet Vice Premier He Lifeng, with outcomes uncertain due to differing negotiating styles. In Australia, firm March CPI, robust Q1 PPI, and rising April consumer inflation expectations (4.2% from 3.6%) suggest the Reserve Bank of Australia may reconsider market expectations of 101bps in rate cuts for 2025, especially as Governor Bullock stresses a data-driven approach amid inflation within the target band. Markets anticipate an RBA rate cut at the May 20 meeting, but persistent inflationary signals could temper this outlook. | ||
| Suggested reading | ||
| Rising Gold Warns Markets: Fed Must Cut Reserve Rates Now, S. Forbes, Forbes (May 7, 2025) Don’t Sell in May to Breakeven, Fisher Investments (May 7, 2025) | ||