


 | ||
| 4th November 2025 | view in browser | ||
| Fed bows to US debt mountain | ||
| The US dollar stays firm amid Fed caution, but Treasury Secretary Bessent blasted its “broken” inflation models and vowed a leadership overhaul to revamp processes, as soaring deficits and debt over GDP push the Fed toward fiscal dominance—prioritizing low rates to manage borrowing costs over inflation control. | ||
| Performance chart 30day v. USD (%) | ||
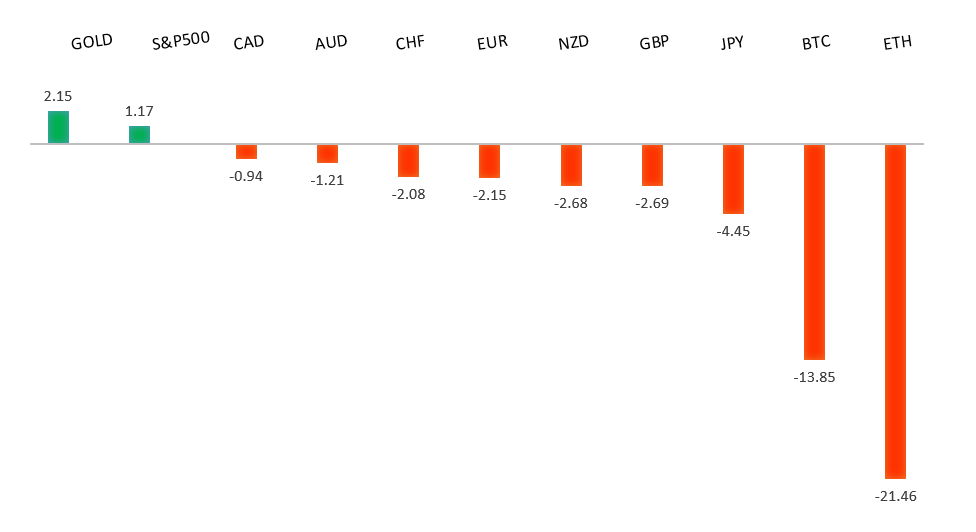 | ||
| Technical & fundamental highlights | ||
| EURUSD: technical overview | ||
| The Euro outlook remains constructive with higher lows sought out on dips in favor of the next major upside extension targeting the 2021 high at 1.2350. Setbacks should be exceptionally well supported ahead of 1.1300. | ||
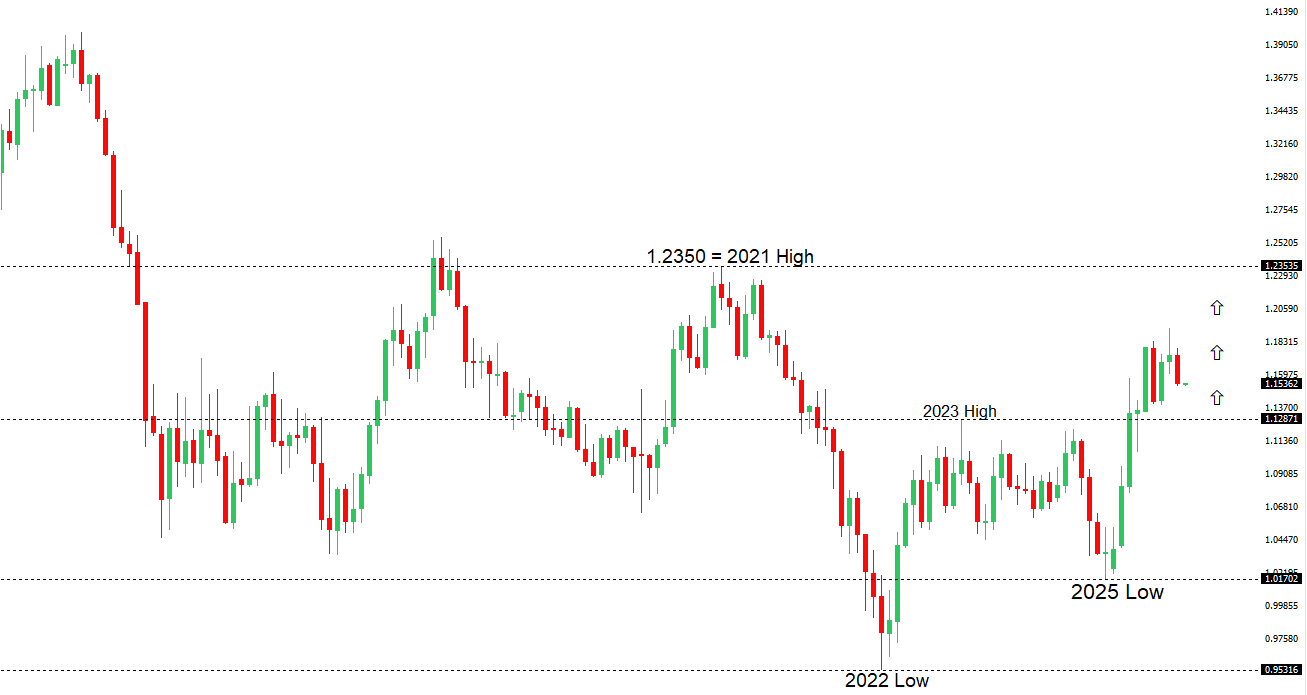 | ||
| R2 1.1729 - 17 October high -Strong R1 1.1669 - 28 October high - Medium S1 1.1446 - 19 June low - Medium S2 1.1392 - 1 August low - Strong | ||
| EURUSD: fundamental overview | ||
| Eurozone October inflation eased to 2.1% year-over-year from 2.2%, staying just above the ECB’s 2% target due to slower rises in food and goods prices, with core inflation steady at 2.4%. The ECB held interest rates unchanged for the third meeting, adopting a cautious, data-dependent approach amid trade uncertainties, while forecasts predict inflation dipping to 1.7% in 2026 before rising to 1.9% in 2027. Policymakers like Joachim Nagel see no need for changes yet, with a December review planned; meanwhile, markets expect less divergence between ECB and Fed rates after Powell’s comments, pressuring EURUSD but likely holding support at 1.1392 without new catalysts. | ||
| USDJPY: technical overview | ||
| There are signs of a meaningful top in place after the market put in a multi-year high in 2024. At this point, the door is now open for a deeper setback below the 2024 low at 139.58, exposing a retest of the 2023 low. Rallies should be well capped below 155.00. | ||
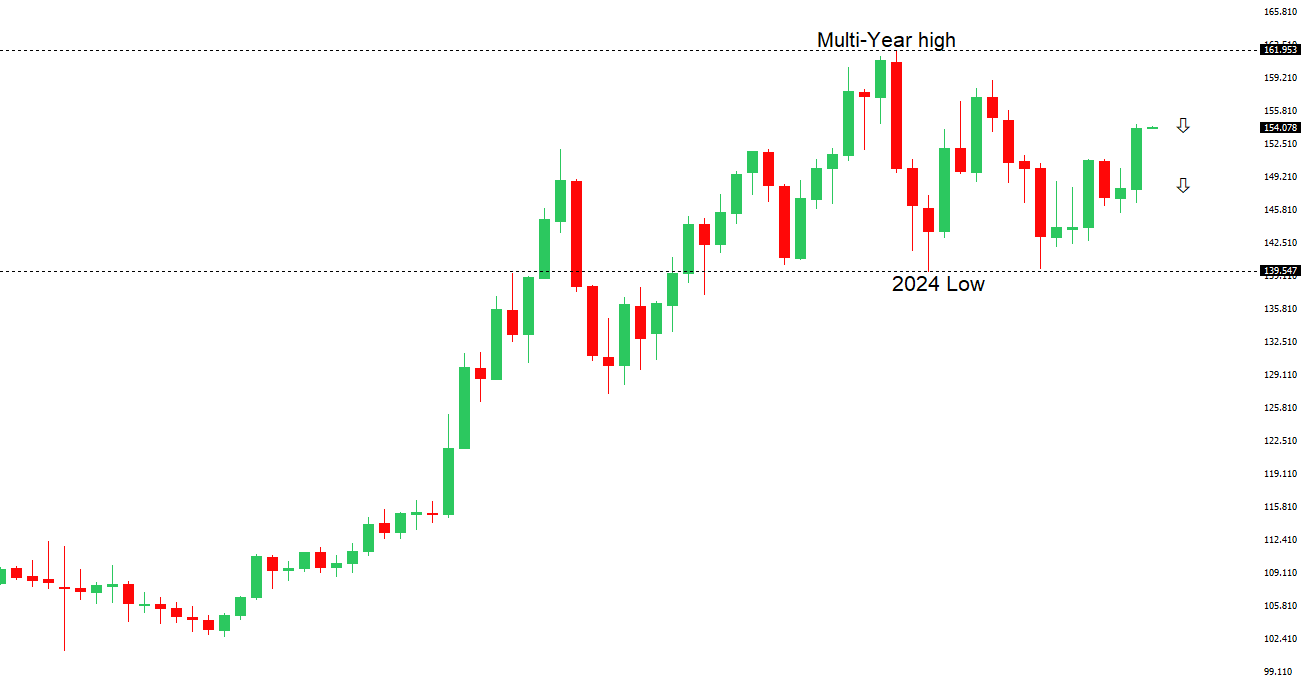 | ||
| R2 154.80 - 12 February high - Strong R1 154.49 - 4 November high - Medium S1 151.54 - 29 October low - Medium S2 149.38 - 17 October low - Strong | ||
| USDJPY: fundamental overview | ||
| The yen remains under pressure and is the worst-performing G10 currency this year. However, we are seeing some demand for the yen on Tuesday after Tokyo’s October inflation rose to 2.8%, supporting gradual BOJ rate hikes, while Finance Minister Katayama’s concerns over sharp yen moves temporarily paused its decline. At the same time, upcoming LDP fiscal stimulus and skepticism toward PM Takaichi’s tax-revenue plans without rate hikes could further weaken the yen. Hedge funds are betting on USDJPY hitting 160 by year-end amid Fed-BOJ policy divergence and the BOJ’s cautious stance, with two major US investment houses ruling out near-term intervention. Thursday’s September wage data, with scheduled full-time pay expected at 2.5% YoY, will be closely watched for progress in the BOJ’s wage-inflation cycle. | ||
| AUDUSD: technical overview | ||
| There are signs of the potential formation of a longer-term base with the market trading down into a meaningful longer-term support zone. Only a monthly close below 0.5500 would give reason for rethink. A monthly close back above 0.7000 will take the big picture pressure off the downside and strengthen case for a bottom. | ||
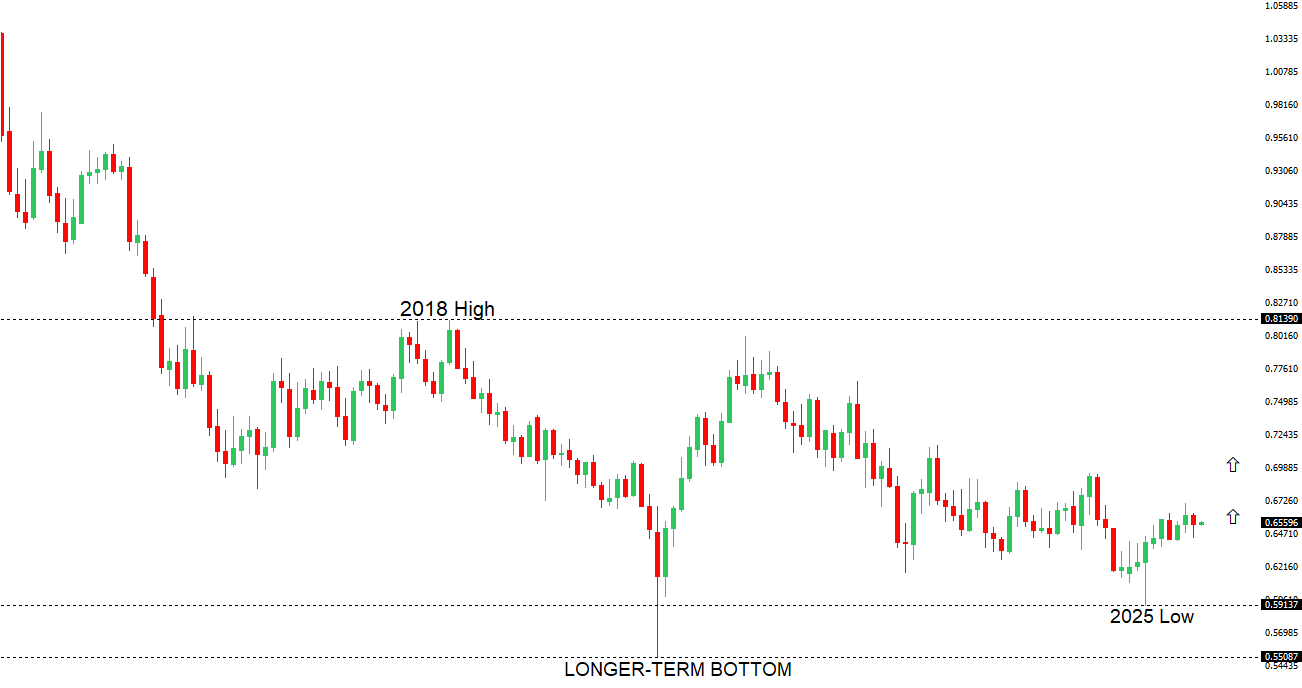 | ||
| R2 0.6629 - 1 October high - Strong R1 0.6618 - 29 October high - Medium S1 0.6471 - 16 October low - Medium S1 0.6440 - 14 October low - Strong | ||
| AUDUSD: fundamental overview | ||
| The Reserve Bank of Australia kept its key interest rate steady at 3.60%, as expected, citing ongoing core inflation, strong consumer spending, and a rebounding housing market as reasons to avoid further rate cuts amid economic uncertainty. Recent data suggest inflation will remain elevated, giving little hint of future policy changes, especially after hotter-than-expected Q3 figures, making a December easing unlikely without clearer signs of cooling demand. With a US-China trade truce boosting global conditions, the Australian dollar may hold firm. | ||
| Suggested reading | ||
| Gold Is a Better Equity Market Tell Than It’s Being Credited For, J. Tamny, Forbes (November 2, 2025) As AI Shares Soar, Are We Living Through 1999 Again?, S. McBride, RiskHedge (October 31, 2025) | ||