


 | ||
| 1st July 2026 | view in browser | ||
| Growth resilience leads into the new quarter | ||
| Strong US data and persistent Fed tightening expectations continue to underpin the dollar and Treasury yields, while record equity markets, AI optimism and a heavy economic calendar keep investors focused on growth and policy expectations. | ||
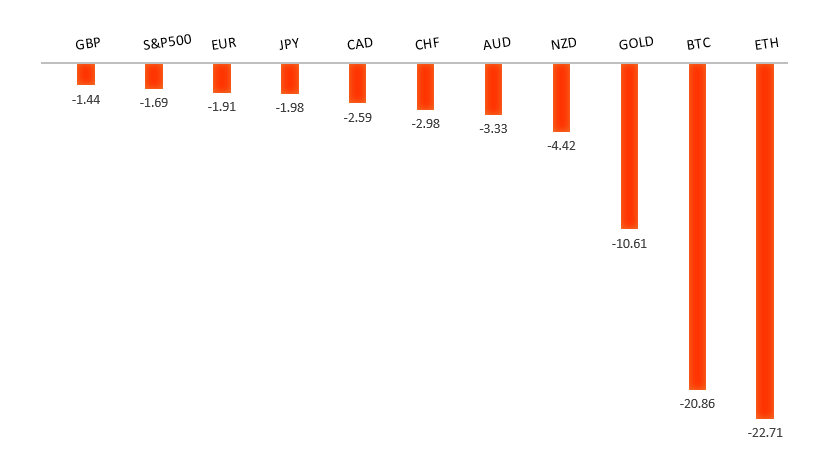
| Performance chart 30day v. USD (%) | ||
 | ||
| Technical & fundamental highlights | ||
| EURUSD: technical overview | ||
| The Euro outlook remains constructive with higher lows sought out on dips in favor of the next major upside extension targeting the 2021 high at 1.2350. Setbacks should be exceptionally well supported ahead of 1.1300. | ||
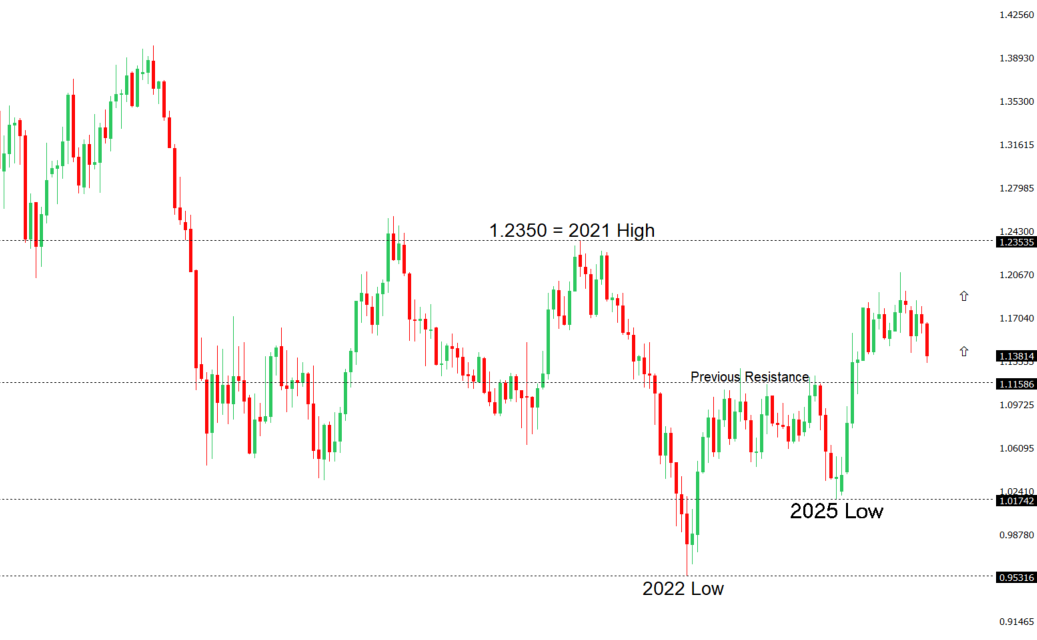 | ||
| R2 1.1529 - 18 June high - Medium R1 1.1440 - 23 June high - Medium S1 1.1325 - 24 June/2026 low - Medium S2 1.1300 - Figure - Medium | ||
| EURUSD: fundamental overview | ||
| The euro remains caught between a still-resilient US Dollar and an increasingly uncertain European Central Bank outlook, leaving EURUSD confined to the low-1.1400s. While month-end portfolio rebalancing and intermittent US Dollar softness have provided some support, the Greenback continues to draw strength from expectations that the Federal Reserve may still need to tighten policy further, reinforced by resilient US economic data and hawkish Fed rhetoric. At the same time, renewed geopolitical tensions in the Middle East have maintained safe-haven demand for the US Dollar. On the European side, ECB officials continue to send mixed signals, with policymakers such as Rehn emphasizing data dependence and downplaying broad second-round inflation risks, while Wunsch has kept the door open to another rate hike if price pressures persist. However, easing energy prices have tempered inflation concerns and reduced market conviction that the ECB will need to tighten much further, leaving traders focused on incoming US labor market data and any fresh guidance from the ECB Forum in Sintra for the next catalyst. | ||
| GBPUSD: technical overview | ||
| The Pound remains exceptionally well supported on dips into the 1.3000 area, with the price largely consolidating above the psychological barrier and previous resistance turned support in the form of the 2023 high. Look for the market to continue be well supported on dips ahead of the next major upside extension through the yearly high at 1.3870 and towards a retest of the 2018 high at 1.4377 further up. Only a monthly close below 1.3000 negates. | ||
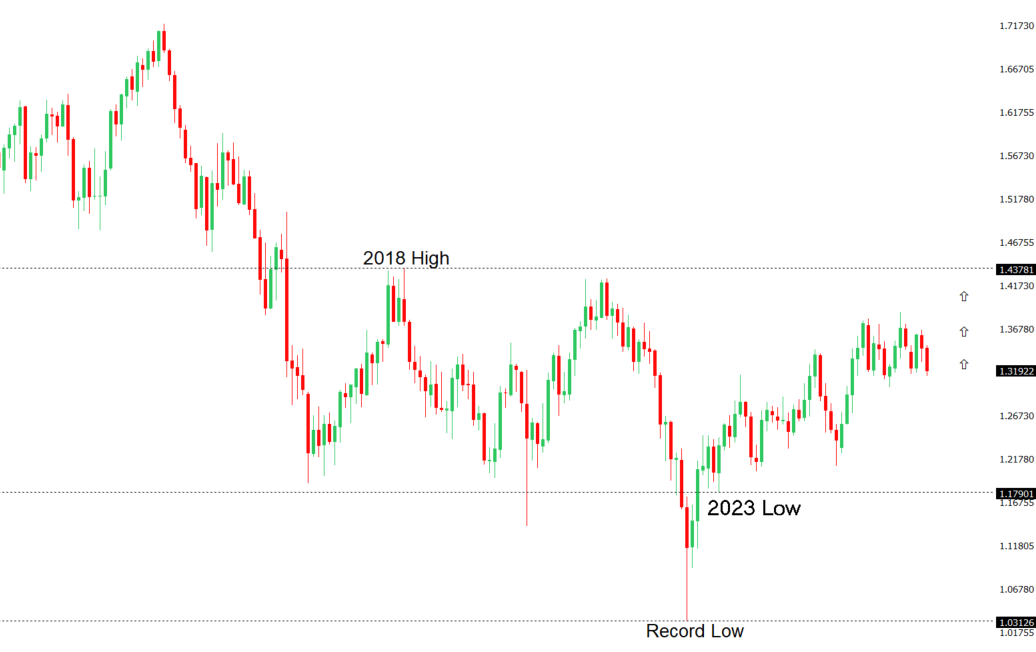 | ||
| R2 1.3325 - 18 June high - Medium R1 1.3277 - 30 June high - Medium S1 1.3140 - 24 June/2026 low - Medium S2 1.3100 - Figure - Medium | ||
| GBPUSD: fundamental overview | ||
| Sterling has traded with a mixed but broadly resilient tone, balancing domestic political and monetary policy developments against a firmer US Dollar. While renewed demand for the Greenback on the back of hawkish Federal Reserve expectations and higher US yields has limited GBPUSD upside, Sterling continues to draw support from the Bank of England’s relatively high policy rate, even as policymakers signal no urgency to tighten policy further. Speaking at the ECB Forum in Sintra, Governor Andrew Bailey reiterated that the BoE is in no rush to raise rates in response to higher energy prices, arguing that tighter market interest rates have already done some of the work and give policymakers time to assess whether higher oil prices generate broader inflation pressures. Although Bailey acknowledged inflation could climb toward 3.2% later this year, he maintained confidence that inflation will ultimately return to the 2% target, pushing back against calls from more hawkish policymakers for an immediate rate hike and reinforcing a patient, data-dependent policy approach. Meanwhile, UK first-quarter GDP expanded 0.6% on the quarter but annual growth slowed more than expected, underscoring a moderating economy despite continued resilience in the services sector. On the political front, markets have welcomed Labour leadership frontrunner Andy Burnham’s commitment to maintaining fiscal discipline, helping ease concerns following Keir Starmer’s resignation announcement and limiting political risk premia. Looking ahead, Sterling remains sensitive to incoming UK inflation and labor market data, while this week’s US employment report is likely to be the key driver of Federal Reserve expectations and broader direction for GBPUSD. | ||
| USDJPY: technical overview | ||
| The major pair has extended its run to fresh multi-decade highs, with the latest push through 160.00 opening the door for further upside towards 165.00-170.00. At the same time, daily studies are looking quite stretched, suggesting we could see a healthy correction on the horizon. A break back below 161.51 would be required to take the immediate pressure off the topside and strengthen the case for a larger pullback. Until then, the market will continue to be focused on additional gains. | ||
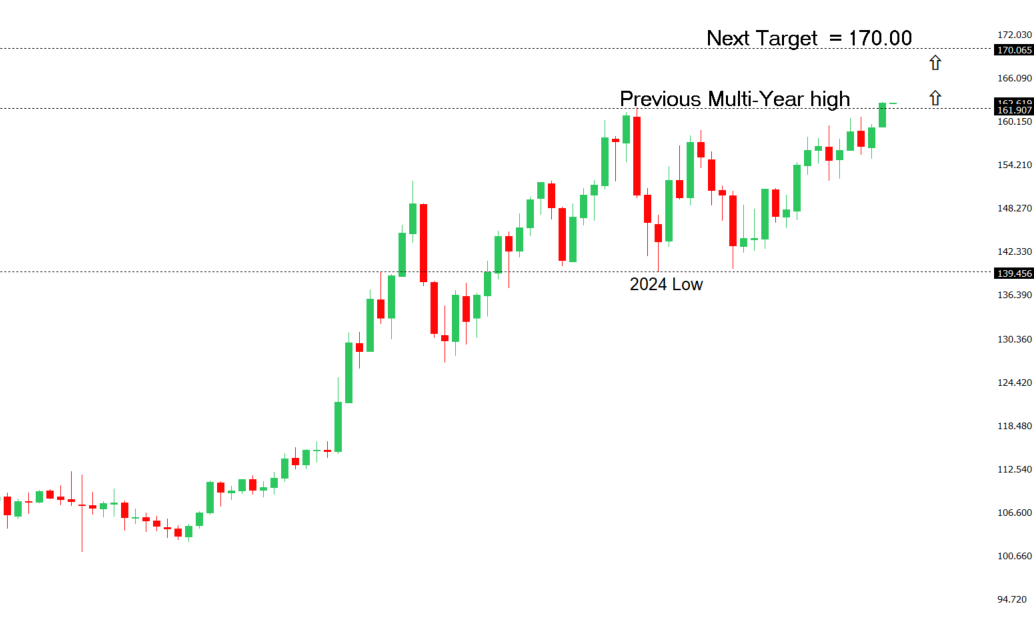 | ||
| R2 163.00 - Figure - Medium R1 162.67 - Multi-Year high/30 June 2026 - Strong S1 161.51 - 29 June low - Strong S2 160.99 - 19 June low - Medium | ||
| USDJPY: fundamental overview | ||
| The Yen remains under heavy pressure as the wide interest rate differential between Japan and the United States continues to drive demand for USDJPY, even after the Bank of Japan raised rates to 1.0% in June. Markets still see Japanese policy as highly accommodative relative to the Federal Reserve, with expectations for another Fed rate hike this year reinforcing the appeal of carry trades and keeping the Dollar well supported. The pair has climbed to fresh multi-decade highs above 162, shifting investor focus to the growing risk of official Japanese intervention, with policymakers repeatedly warning they stand ready to act against excessive currency moves. However, traders remain cautious about betting on sustained Yen strength, as any intervention is widely viewed as likely to slow rather than reverse the broader trend unless accompanied by a narrowing in the US-Japan yield gap. Attention now turns to upcoming US labor market data and further Fed commentary, which could determine whether USDJPY extends toward the 163.00 level or triggers intervention from Tokyo. | ||
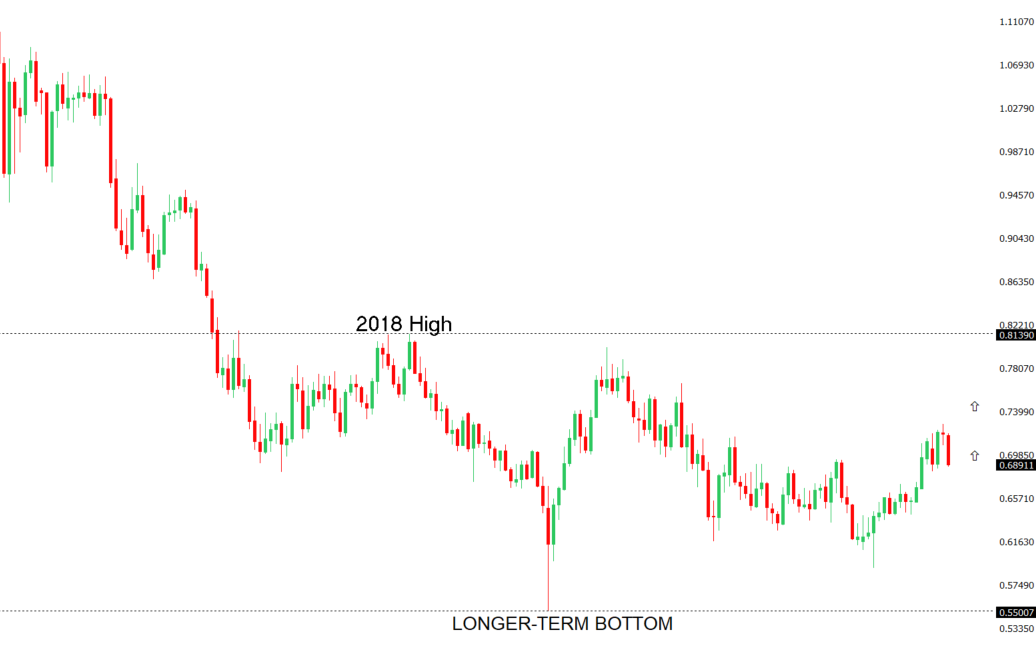
| AUDUSD: technical overview | ||
| There are signs of the formation of a longer-term base with the market recovering out from a meaningful longer-term support zone. The latest monthly close back above 0.7000 takes the big picture pressure off the downside and strengthens the case for a bottom, with the focus now on a push towards 0.8000. Setbacks should now be well supported ahead of 0.6700. | ||
 | ||
| R2 0.7089 - 15 June high - Strong R1 0.6979 - 11 June low - Medium S1 0.6865 - 30 June low - Medium S2 0.6833 - 30 March low - Strong | ||
| AUDUSD: fundamental overview | ||
| The Australian Dollar has found renewed support after rebounding from recent lows, underpinned by a hawkish set of RBA meeting minutes that reinforced policymakers’ willingness to tighten policy further if inflation proves more persistent. While the central bank kept rates unchanged at 4.35%, officials stressed that inflation remains well above target, excess demand and cost pressures persist, and policy will need to stay restrictive until price stability is restored. The Aussie has also benefited from encouraging Chinese data, with both manufacturing and services PMIs returning to or remaining in expansion territory, improving the outlook for Australia’s largest export market and supporting commodity demand. Domestically, resilient employment, sticky underlying inflation and solid business activity continue to reinforce expectations that the RBA will remain one of the more hawkish G10 central banks. Against this, gains have been tempered by a still-resilient US economy and a Federal Reserve that continues to signal a cautious approach to easing, leaving AUDUSD largely driven by the balance between relative central bank expectations, global risk sentiment and incoming US data. | ||
| Suggested reading | ||
| Can Kazakhstan’s oil boom survive Putin’s War?, A. Stognei, Financial Times (June 30, 2026) 2026’s Best Performing S&P 500 Stocks, B. Nguyen, Marketwatch (June 30, 2026) | ||