


 | ||
| 21st August 2026 | view in browser | ||
| Dollar slides as fiscal concerns rattle markets | ||
| Global markets head into Friday with the dollar under pressure and gold advancing on US fiscal credibility concerns, while rebounding Treasury yields, elevated oil prices and persistent US-Iran tensions weigh on equities and sustain inflation risks. | ||
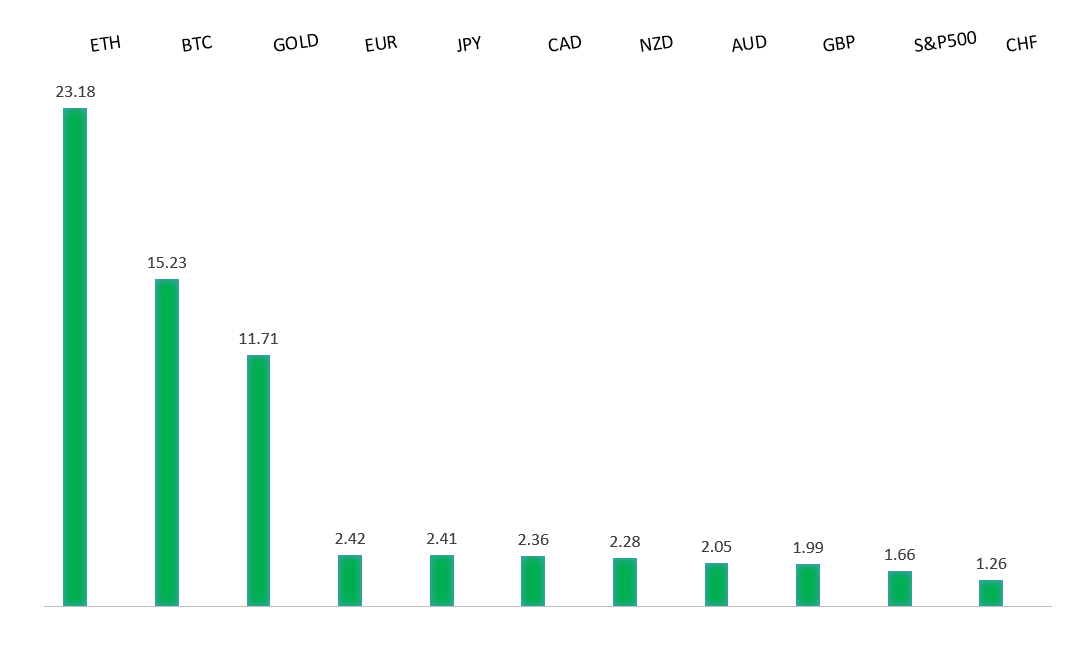
| Performance chart 30day v. USD (%) | ||
 | ||
| Technical & fundamental highlights | ||
| EURUSD: technical overview | ||
| The Euro outlook remains constructive with higher lows sought out on dips in favor of the next major upside extension targeting the 2021 high at 1.2350. Setbacks should be exceptionally well supported ahead of 1.1400. | ||
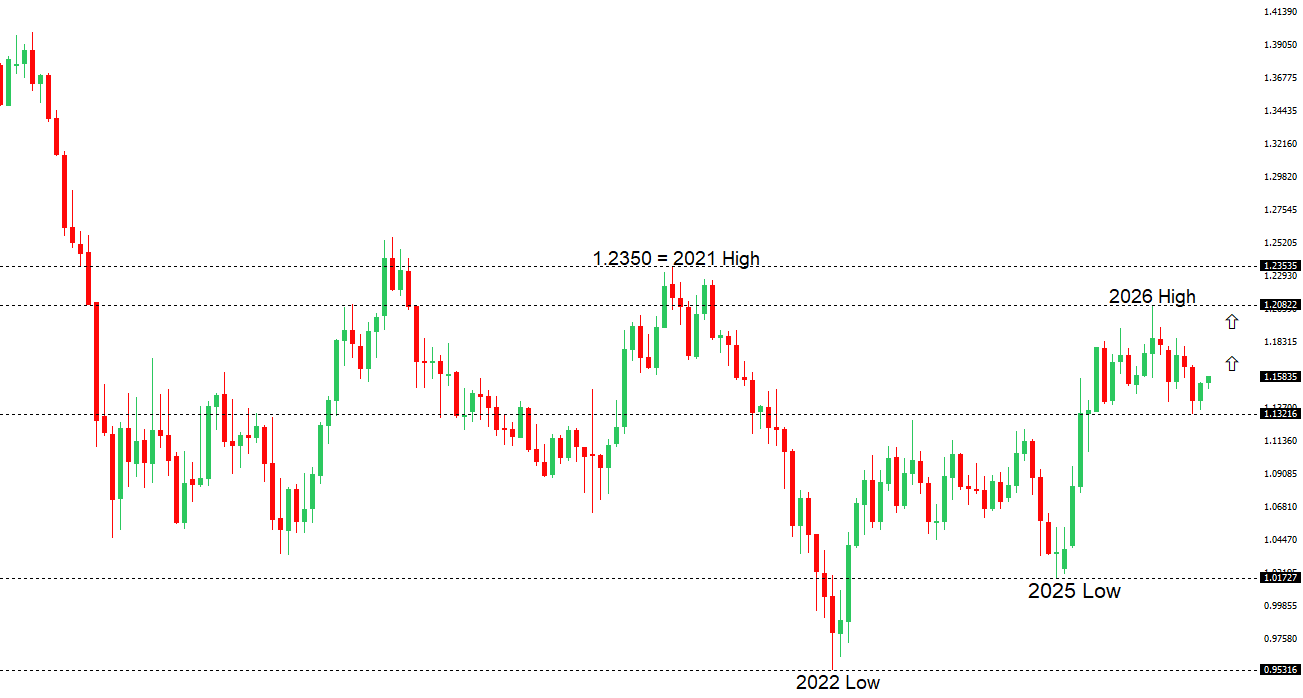 | ||
| R2 1.1797 - 6 May high - Medium R1 1.1711 - 20 August high - Medium S1 1.1570 - 19 May low - Medium S2 1.1512 - 313 August low - Medium | ||
| EURUSD: fundamental overview | ||
| The euro remains well supported near multi-month highs against the dollar, driven by broad USD weakness and growing expectations that the ECB may need to tighten policy further. Euro-area inflation rose to 2.9% in July, with energy prices increasing 10.3% year-on-year, reinforcing concerns that elevated oil and gas costs could keep price pressures above the ECB’s target and prompting markets to price a more hawkish policy path. The currency has also benefited from a modest improvement in the regional economy, including 0.4% second-quarter growth, although weak retail activity and renewed energy-supply risks remain headwinds. EURUSD’s advance has stalled around 1.1700 as hawkish Fed minutes, elevated US yields and geopolitical tensions provide the dollar with some support, leaving the upcoming Eurozone and US flash PMIs as the next important test of the relative growth and rate outlooks. | ||
| GBPUSD: technical overview | ||
| The Pound remains exceptionally well supported on dips into the 1.3000 area, with the price largely consolidating above the psychological barrier and previous resistance turned support in the form of the 2023 high. Look for the market to continue be well supported on dips ahead of the next major upside extension through the yearly high at 1.3870 and towards a retest of the 2018 high at 1.4377 further up. Only a monthly close below 1.3000 negates. | ||
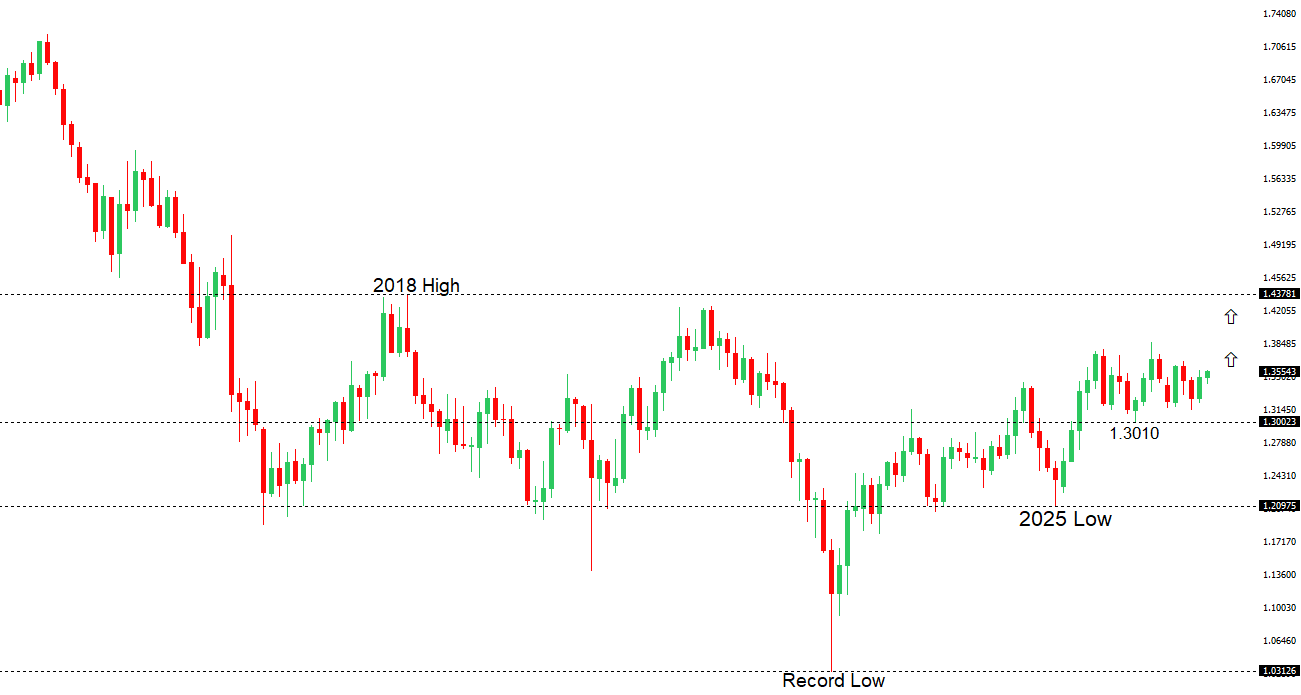 | ||
| R2 1.3700 - Figure - Strong R1 1.3660 - 20 August high - Medium S1 1.3523 - 19 August low - Medium S2 1.3474 - 13 Augus low - Medium | ||
| GBPUSD: fundamental overview | ||
| The pound remains well supported near six-month highs against the US dollar. Sterling’s advance has been driven primarily by broad dollar weakness following the US Treasury’s expansion of long-dated bond buybacks, which has raised concerns about US fiscal credibility and pushed investors away from the greenback. Domestically, persistent UK inflation has reinforced expectations that the Bank of England may need to raise rates again, providing an additional tailwind for sterling despite signs of cooling employment and wage growth. July retail sales fell 0.5% month-on-month, while the annual increase of 1.6% undershot expectations, but the figures were not weak enough to materially alter the BoE outlook. Larger-than-expected public borrowing also highlighted ongoing fiscal concerns, leaving the pound’s strength largely dependent on favorable rate expectations and continued pressure on the dollar. | ||
| USDJPY: technical overview | ||
| The major pair has entered a period of correction and consolidation after extending its run to fresh multi-decade highs at 163.99. Setbacks are now expected to be well supported above 155.00, with only a break below to compromise the bullish structure. | ||
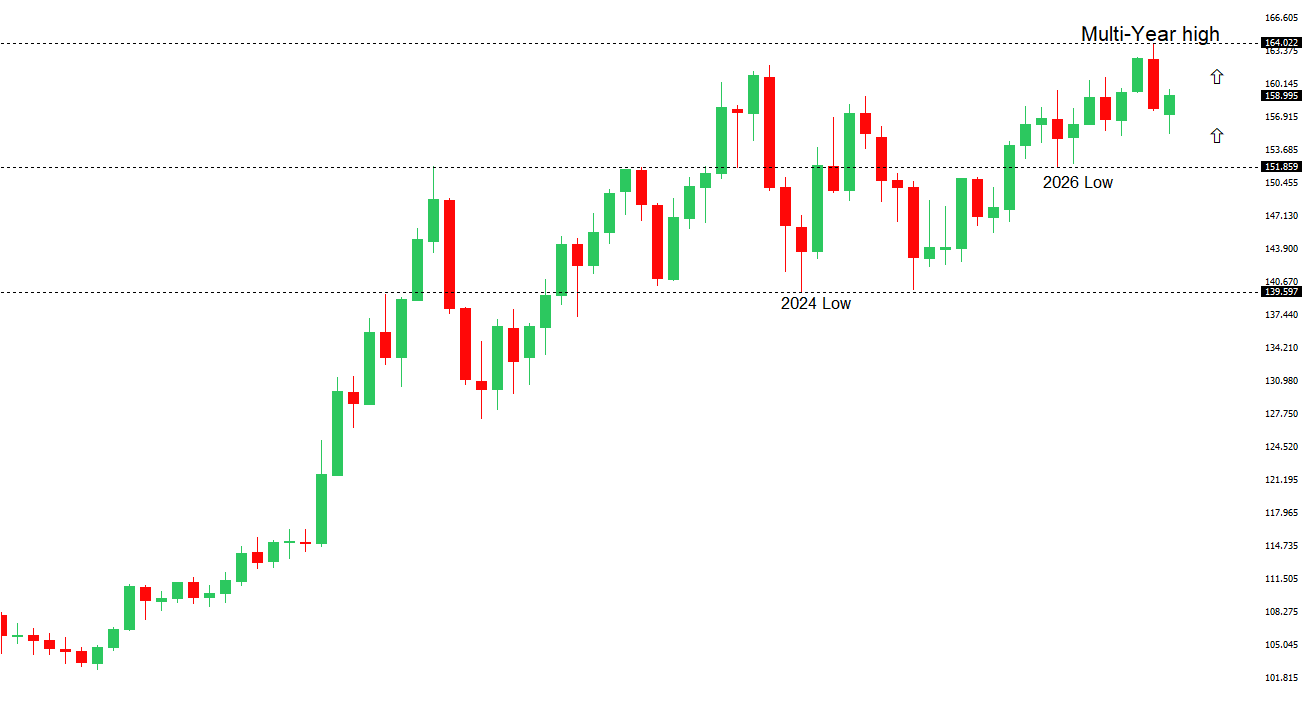 | ||
| R2 160.00 - Psychological - Strong R1 159.78 - 17 August high - Medium S1 158.02 - 20 August low - Medium S2 156.67 - 7 August low - Medium | ||
| USDJPY: fundamental overview | ||
| The yen has been trading in a narrow range against the dollar, supported by expectations that the Bank of Japan will continue gradually tightening policy but restrained by Japan’s still-wide interest-rate disadvantage and rising import costs. Japan’s core national CPI accelerated to 1.8% year-over-year in July from 1.6%, matching expectations and reinforcing the case for further BoJ normalization, although inflation remains below the central bank’s 2% target. At the same time, Japan’s widening trade deficit and elevated energy costs have limited the currency’s recovery. On the US side, Treasury plans to expand long-dated bond buybacks have lowered yields and weakened the dollar, easing pressure on the yen and pulling USDJPY slightly away from the psychologically important 160 level. | ||
| AUDUSD: technical overview | ||
| There are signs of the formation of a longer-term base with the market recovering out from a meaningful longer-term support zone. The latest monthly close back above 0.7000 takes the big picture pressure off the downside and strengthens the case for a bottom, with the focus now on a push towards 0.8000. Setbacks should now be well supported ahead of 0.6700. | ||
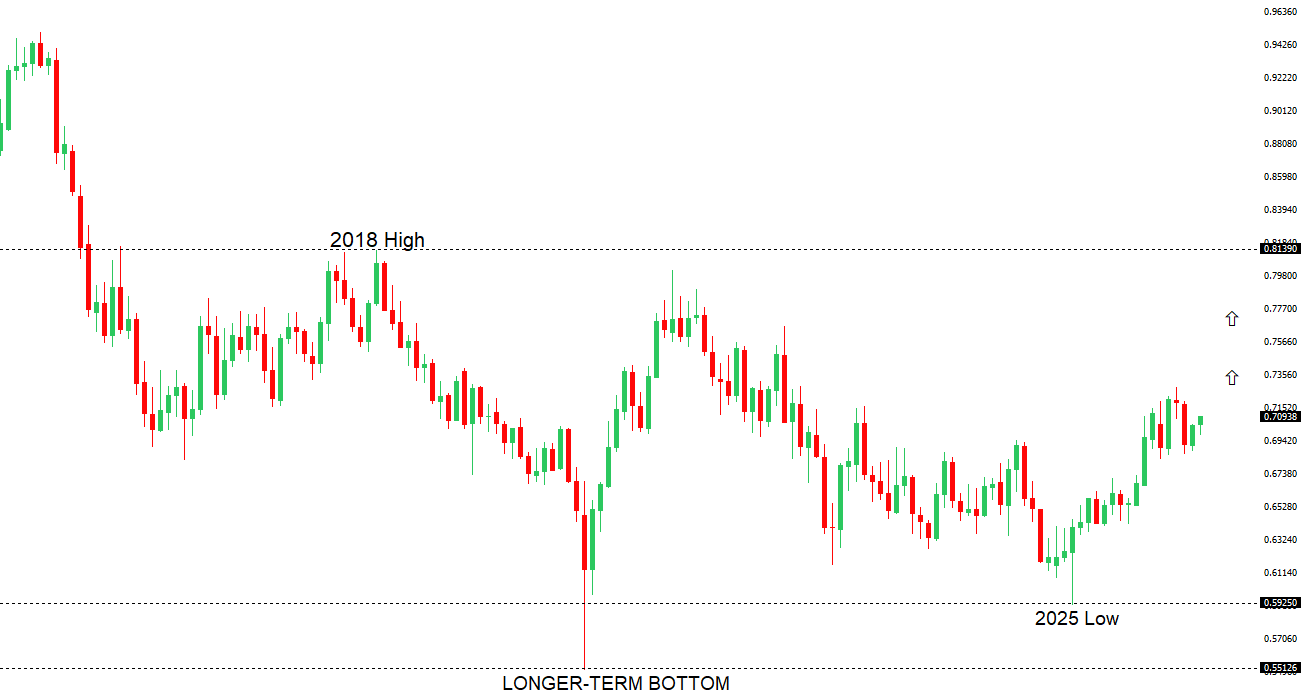 | ||
| R2 0.7201 - 29 May high - Strong R1 0.7149 - 21 August high - Medium S1 0.7067 - 19 August low - Medium S2 0.6984 - 3 August low - Strong | ||
| AUDUSD: fundamental overview | ||
| The Australian dollar has regained ground above 0.7100, but the advance has been driven primarily by broad US-dollar weakness rather than improving domestic fundamentals. Concerns about the US fiscal outlook and skepticism that the Treasury’s expanded long-dated bond-buyback program will provide more than temporary relief have weighed on the greenback and supported AUDUSD. However, the Aussie’s upside has been tempered by a clear softening in Australia’s labor market: employment unexpectedly fell by 15,800 in July, while unemployment rose from 4.4% to 4.5%, strengthening the argument for the RBA to pause rather than raise rates again in September. The RBA still considers the labor market somewhat tight and remains alert to persistent inflation, but the latest employment figures have reduced the urgency for further tightening, leaving the currency caught between supportive external US-dollar dynamics and a less favorable domestic rate outlook. | ||
| Suggested reading | ||
| How Jack Bogle Changed Investing, A. Roth, Morningstar (August 18, 2026) Corporate Earnings Are Not a Mirage, They Signal Strength, Fisher Investments (August 18, 2026) | ||