


 | ||
| 20th August 2026 | view in browser | ||
| Geopolitical premium versus Treasury put | ||
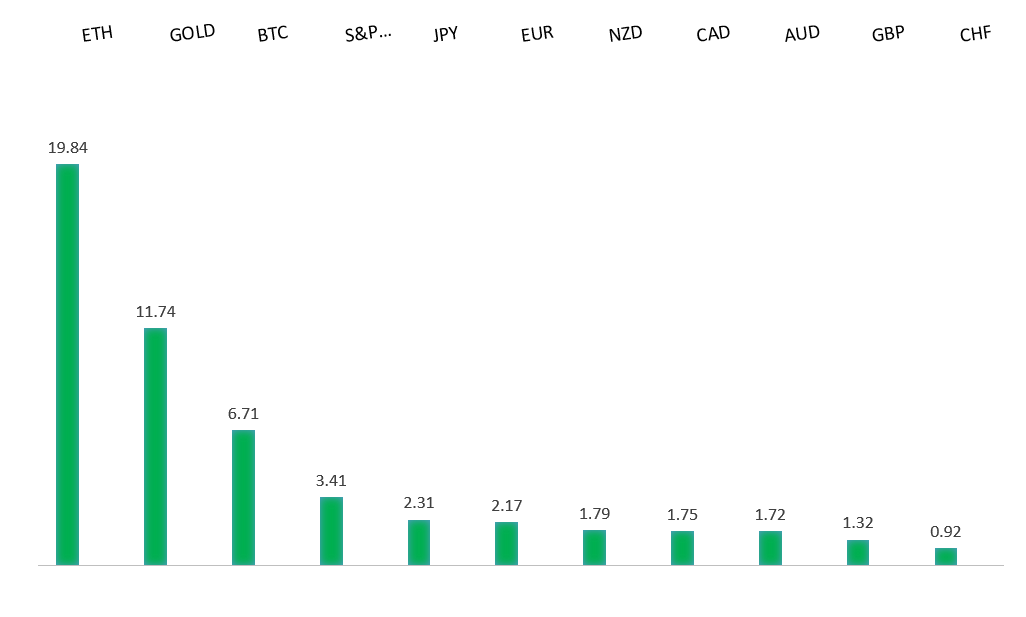
| Global markets head into Thursday with a weaker dollar, lower Treasury yields and firmer equities after expanded US bond buybacks, while surging gold and elevated oil reflect persistent fiscal, inflation and Iran-related geopolitical risks. | ||
| Performance chart 30day v. USD (%) | ||
 | ||
| Technical & fundamental highlights | ||
| EURUSD: technical overview | ||
| The Euro outlook remains constructive with higher lows sought out on dips in favor of the next major upside extension targeting the 2021 high at 1.2350. Setbacks should be exceptionally well supported ahead of 1.1400. | ||
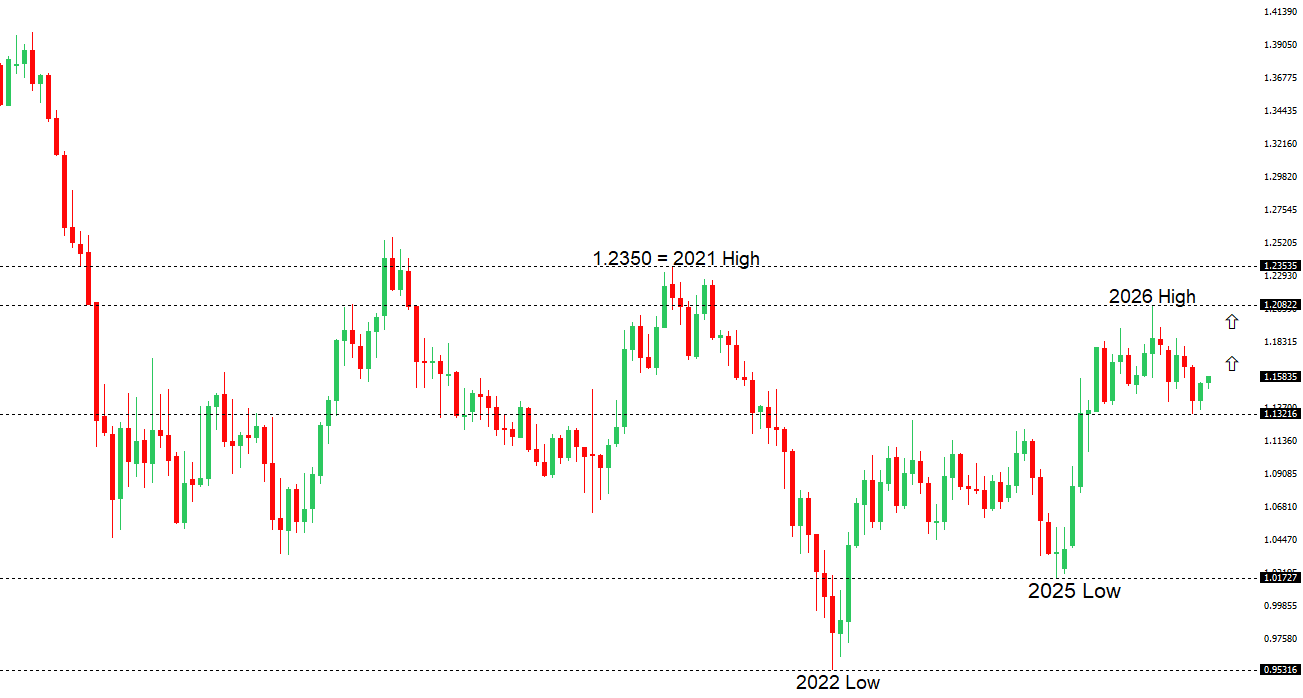 | ||
| R2 1.1797 - 6 May high - Medium R1 1.1686 - 29 May high - Strong S1 1.1570 - 19 May low - Medium S2 1.1512 - 313 August low - Medium | ||
| EURUSD: fundamental overview | ||
| The euro has seen some profit-taking after its sharp advance rather than a material deterioration in the single currency’s fundamentals. The July Fed minutes revealed increased concern over persistent inflation and showed that many officials believe higher rates may be required if price pressures fail to ease, providing the dollar with some near-term support. However, softer US inflation and employment data have reduced expectations for an imminent Fed move, limiting the euro’s downside. Meanwhile, the prospect of further ECB tightening remains a key source of support, with markets assigning a high probability to a 25-basis-point September hike and pricing roughly 45 basis points of additional tightening this year. Eurozone inflation rose to 2.9% in July, elevated energy prices threaten further pressure, and a somewhat firmer regional growth outlook is reinforcing the upward repricing in European rates, leaving the relative policy backdrop broadly supportive for the euro despite its latest pullback. | ||
| GBPUSD: technical overview | ||
| The Pound remains exceptionally well supported on dips into the 1.3000 area, with the price largely consolidating above the psychological barrier and previous resistance turned support in the form of the 2023 high. Look for the market to continue be well supported on dips ahead of the next major upside extension through the yearly high at 1.3870 and towards a retest of the 2018 high at 1.4377 further up. Only a monthly close below 1.3000 negates. | ||
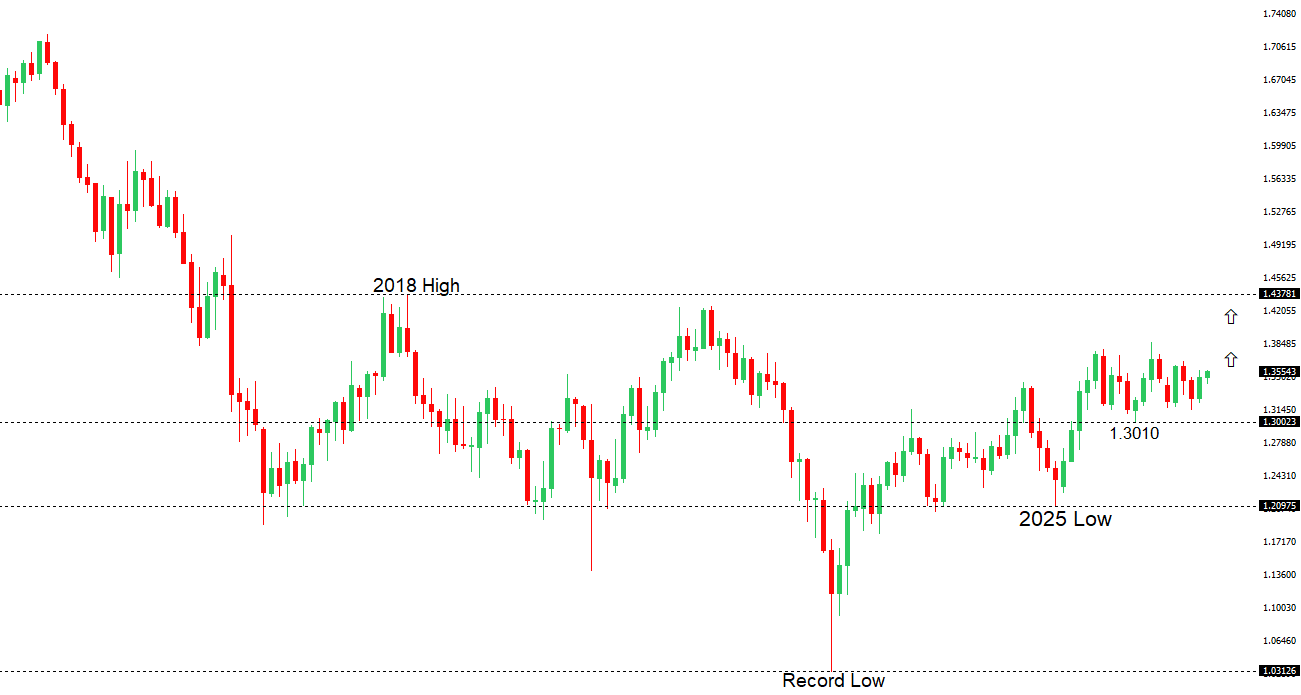 | ||
| R2 1.3658 - 1 May high - Strong R1 1.3631 - 19 August high - Medium S1 1.3523 - 19 August low - Medium S2 1.3474 - 13 Augus low - Medium | ||
| GBPUSD: fundamental overview | ||
| The pound’s downside remains limited on account of a broad based US Dollar selloff and after UK headline inflation accelerated from 2.6% to 2.9% in July, slightly above the Bank of England’s forecast, reinforcing market expectations for at least one rate hike before year-end. The details however, were less decisively hawkish, with core inflation steady, services inflation easing and wage growth slowing, while weaker UK employment figures have also highlighted risks to the economic outlook. But ultimately, the pound remains well supported by a relatively firm BoE rate path, with further gains dependent on whether incoming data validates market pricing that remains more hawkish than the consensus among economists. | ||
| USDJPY: technical overview | ||
| The major pair has entered a period of correction and consolidation after extending its run to fresh multi-decade highs at 163.99. Setbacks are now expected to be well supported above 155.00, with only a break below to compromise the bullish structure. | ||
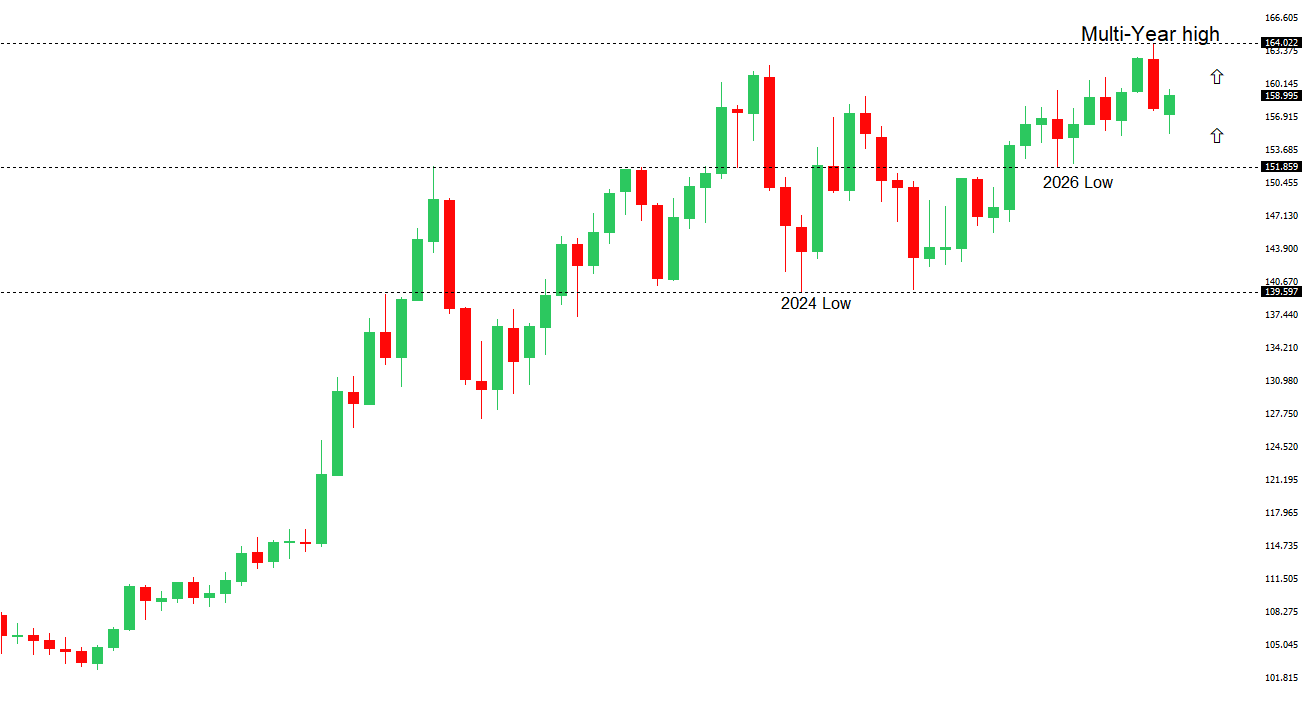 | ||
| R2 160.00 - Psychological - Strong R1 159.78 - 17 August high - Medium S1 157.54 - 10 August low - Medium S2 156.67 - 7 August low - Medium | ||
| USDJPY: fundamental overview | ||
| The yen remains under pressure as Japan’s trade deficit widened to ¥634.5 billion in July, with a sharp rise in imports outpacing record exports and reinforcing concerns over the economic impact of elevated energy and other imported costs. Wide US-Japan interest-rate differentials continue to favor USDJPY, while fiscal concerns have added to the yen’s vulnerability. The dollar has also found some support from hawkish-leaning Fed minutes, although softer US inflation pressures and reduced expectations for a near-term Fed rate hike have limited the upside. Looking ahead, the yen’s prospects may depend heavily on whether energy prices retreat, the Bank of Japan maintains a credible path toward further tightening, or Japanese authorities intervene again as USDJPY trades near levels that could increase official concern. | ||
| AUDUSD: technical overview | ||
| There are signs of the formation of a longer-term base with the market recovering out from a meaningful longer-term support zone. The latest monthly close back above 0.7000 takes the big picture pressure off the downside and strengthens the case for a bottom, with the focus now on a push towards 0.8000. Setbacks should now be well supported ahead of 0.6700. | ||
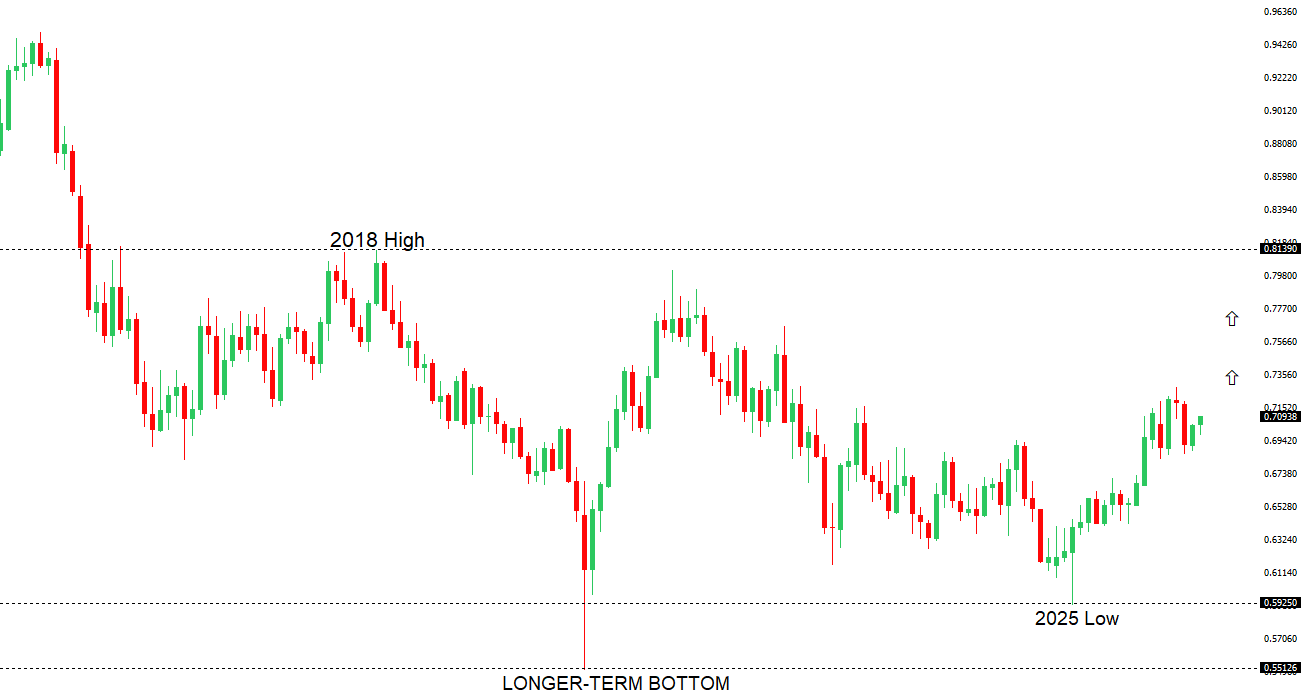 | ||
| R2 0.7201 - 29 May high - Strong R1 0.7130 - 17 August high - Medium S1 0.7022 - 7 August low - Medium S2 0.6984 - 3 August low - Strong | ||
| AUDUSD: fundamental overview | ||
| The Australian dollar’s latest run of gains has been capped after a disappointing domestic labor report raised concerns about the economy and reduced the likelihood of near-term Reserve Bank of Australia tightening. Australia’s unemployment rate unexpectedly rose to 4.5% in July, while employment fell by 15,800 following June’s sharp 80,200 increase, falling well short of expectations for a 15,000 gain. Markets are consequently pricing only a modest chance of further RBA tightening, while weaker Chinese demand for Australian commodities and broader concerns over China’s economy remain additional headwinds for the currency. Nevertheless, the downside in AUDUSD has been partly contained by a softer US dollar, as cooling US inflation pressures have reduced expectations for an imminent Federal Reserve rate increase, despite the latest Fed minutes showing officials remain prepared to tighten if inflation fails to ease. | ||
| Suggested reading | ||
| Why Active Fund Manages Lose, L. Swedroe, Wealth Management (August 18, 2026) The Myth of the China Shock, M. Strain, Project Syndicate (August 18, 2026) | ||