


 | ||
| 24th August 2026 | view in browser | ||
| Treasury buybacks reshape the global market tone | ||
| Markets open Monday defensively, with the dollar near multi-month lows following expanded Treasury buybacks, equities pressured by elevated yields and US-Canada trade tensions, gold benefiting from haven demand, and oil easing despite persistent Iran and Strait of Hormuz risks. | ||
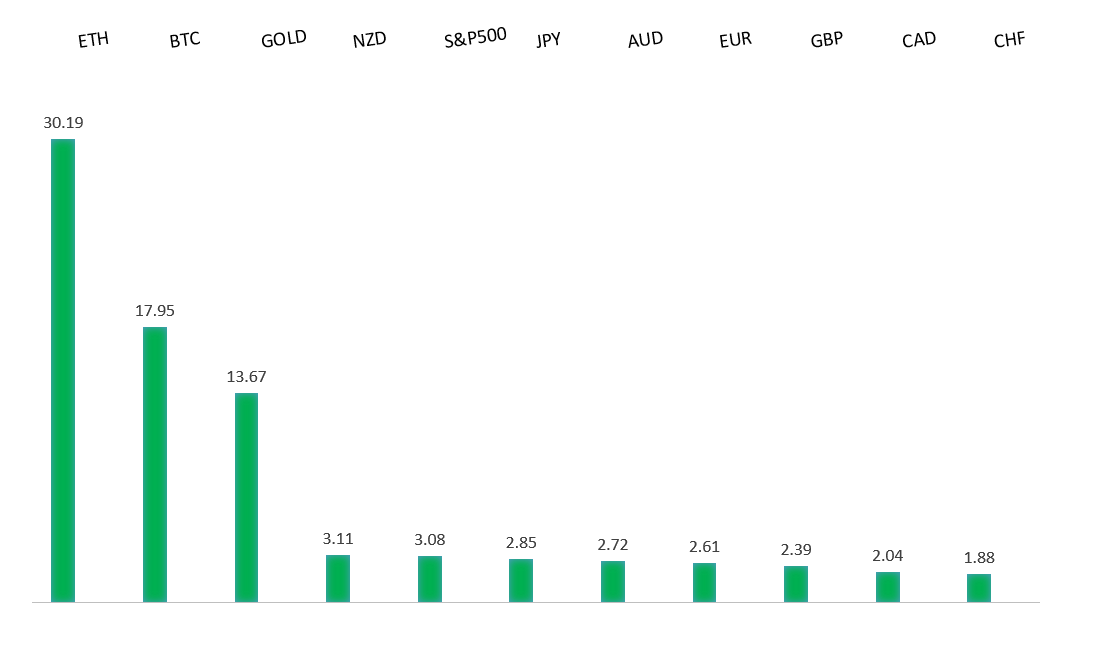
| Performance chart 30day v. USD (%) | ||
 | ||
| Technical & fundamental highlights | ||
| EURUSD: technical overview | ||
| The Euro outlook remains constructive with higher lows sought out on dips in favor of the next major upside extension targeting the 2021 high at 1.2350. Setbacks should be exceptionally well supported ahead of 1.1400. | ||
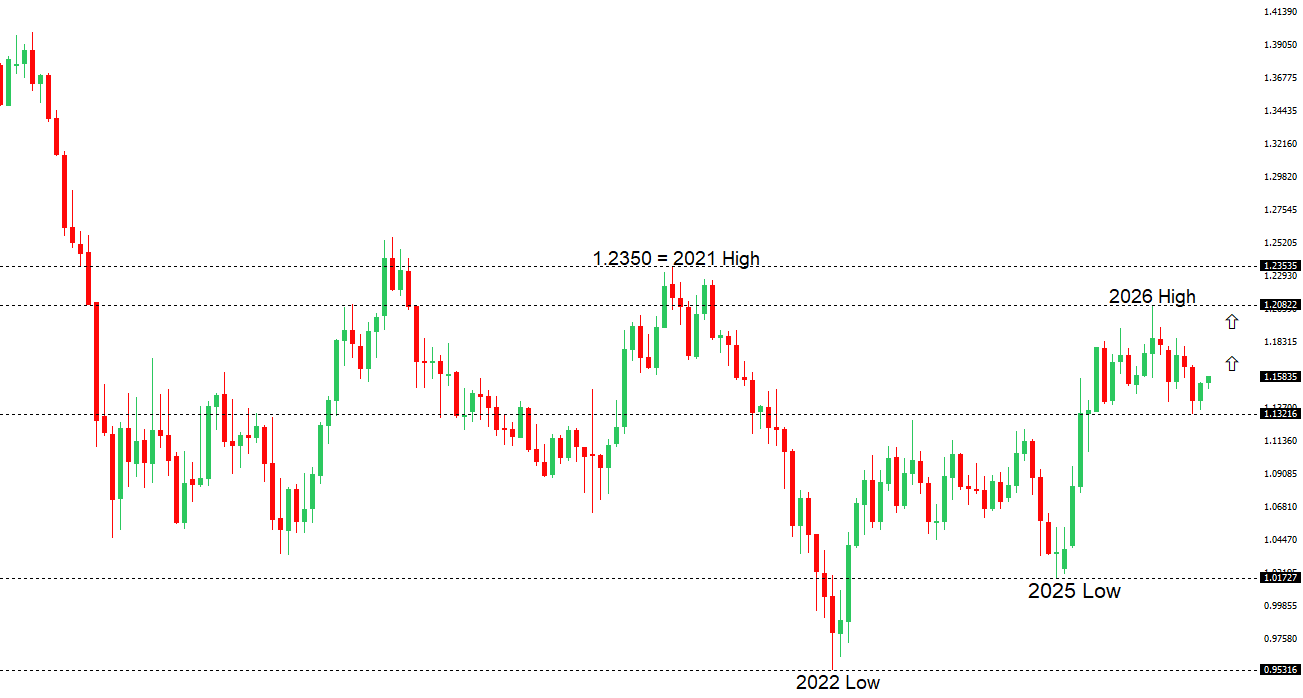 | ||
| R2 1.1797 - 6 May high - Medium R1 1.1712 - 21 August high - Medium S1 1.1570 - 19 May low - Medium S2 1.1512 - 313 August low - Medium | ||
| EURUSD: fundamental overview | ||
| The euro remains well supported near three-month highs against the dollar, though the latest advance has been driven more by broad US currency weakness than by a marked improvement in euro-area fundamentals. Investor concern over the US fiscal outlook and the Treasury’s decision to expand long-dated bond buybacks has weighed on the greenback, while the ECB’s decision to keep rates unchanged and elevated euro-area inflation have preserved expectations that policy will remain restrictive. The euro-area growth backdrop is still subdued, however, with soft domestic demand, slowing job creation and lingering uncertainty from higher energy prices limiting the case for sustained euro strength. Near-term direction should therefore hinge heavily on US developments, particularly Fed Chair Warsh’s Jackson Hole speech, upcoming inflation data and details of new sanctions on Iran, with a hawkish Fed message or renewed geopolitical demand for the dollar posing the clearest downside risks to EURUSD. | ||
| GBPUSD: technical overview | ||
| The Pound remains exceptionally well supported on dips into the 1.3000 area, with the price largely consolidating above the psychological barrier and previous resistance turned support in the form of the 2023 high. Look for the market to continue be well supported on dips ahead of the next major upside extension through the yearly high at 1.3870 and towards a retest of the 2018 high at 1.4377 further up. Only a monthly close below 1.3000 negates. | ||
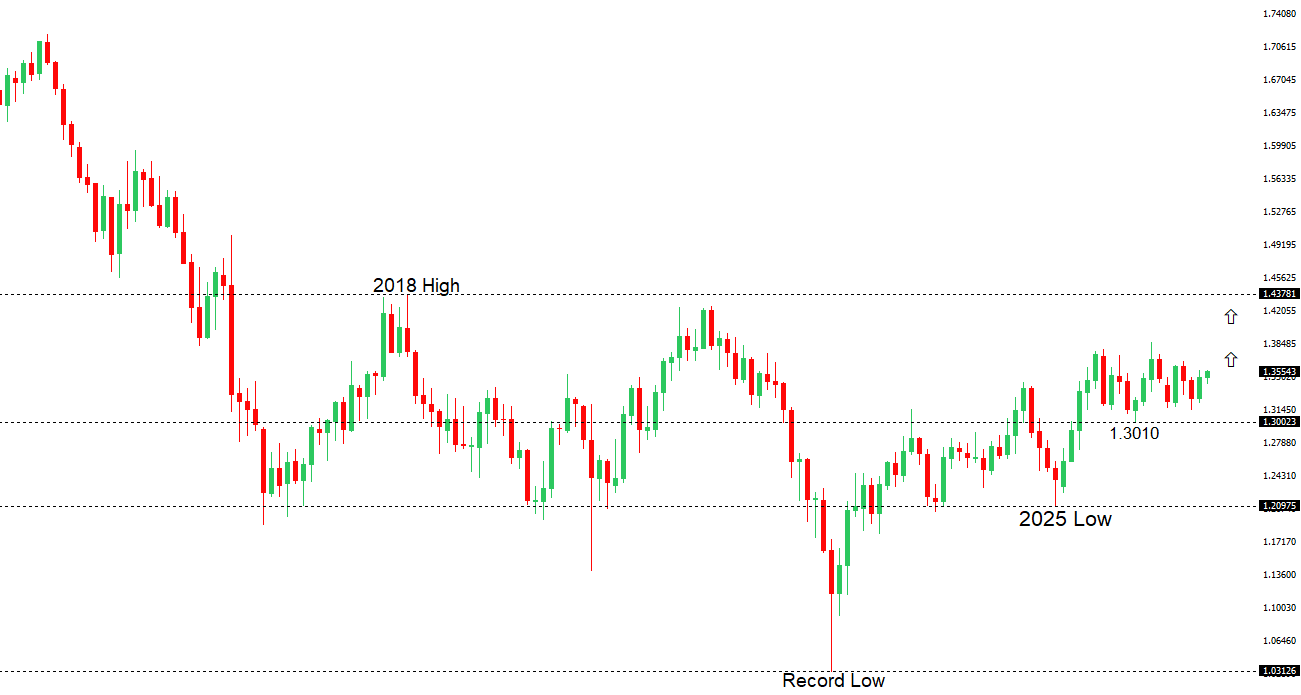 | ||
| R2 1.3700 - Figure - Strong R1 1.3676 - 21 August high - Medium S1 1.3523 - 19 August low - Medium S2 1.3474 - 13 Augus low - Medium | ||
| GBPUSD: fundamental overview | ||
| The pound remains well supported near six-month highs against the dollar, although the advance continues to reflect broad USD weakness more than a decisive improvement in UK fundamentals. The greenback has been pressured by reduced expectations for an imminent Fed rate hike, falling Treasury yields and concerns that expanded US debt buybacks amount to indirect yield suppression. Domestically, sterling is benefiting from the UK economy’s relative resilience and July inflation rising to 2.9%, which has kept one Bank of England rate increase priced by year-end. However, softer wage growth, a cooling labor market and a 0.5% fall in July retail sales argue against an aggressive BoE tightening cycle. This leaves the pound’s outlook constructive but vulnerable if rising oil prices intensify global risk aversion, support the safe-haven dollar or further squeeze UK household spending. | ||
| USDJPY: technical overview | ||
| The major pair has entered a period of correction and consolidation after extending its run to fresh multi-decade highs at 163.99. Setbacks are now expected to be well supported above 155.00, with only a break below to compromise the bullish structure. | ||
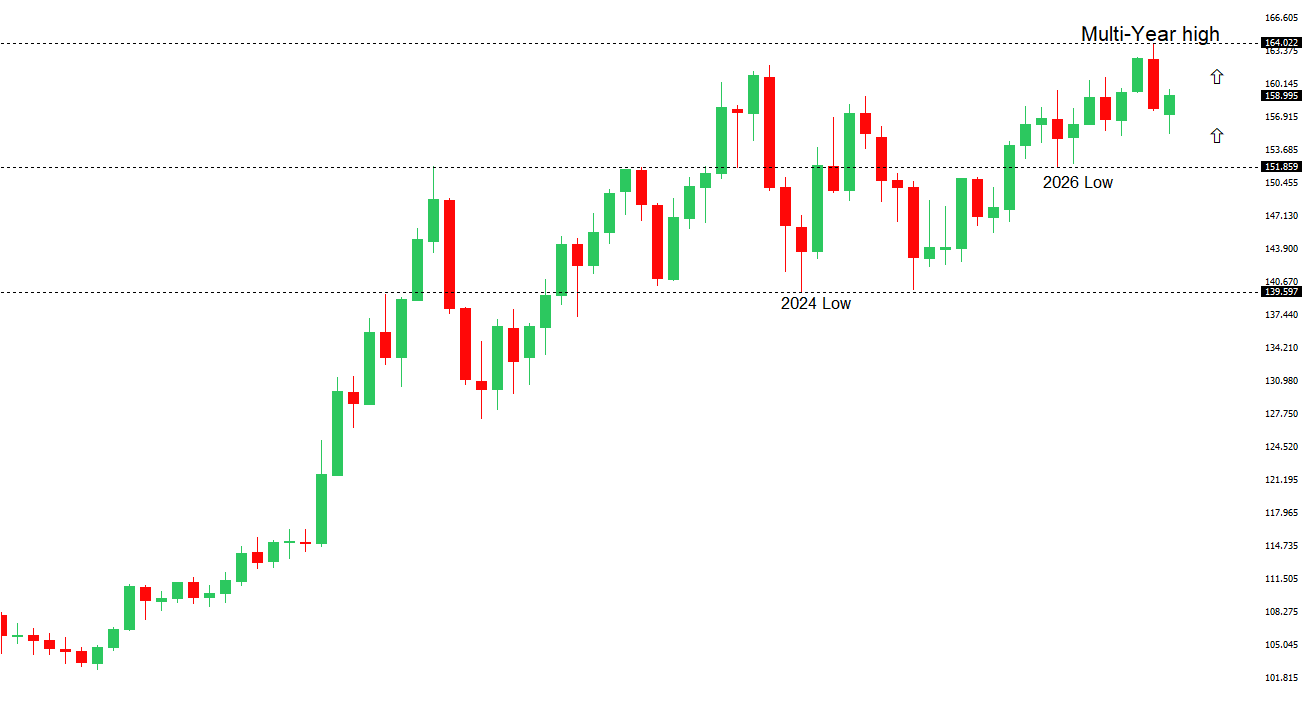 | ||
| R2 160.00 - Psychological - Strong R1 159.78 - 17 August high - Medium S1 158.02 - 20 August low - Medium S2 156.67 - 7 August low - Medium | ||
| USDJPY: fundamental overview | ||
| The yen has strengthened modestly, as firmer Japanese inflation reinforced expectations that the Bank of Japan could raise rates again in September. July core CPI accelerated to 1.8% year-on-year from 1.6%, while the measure excluding fresh food and energy rose to 1.9%, suggesting that underlying price pressures are broadening and supporting Governor Ueda’s push toward further policy normalization. Markets are now assigning a high probability to a 25-basis-point increase to 1.25% at the September meeting. The yen has also benefited from a softer US dollar and lower Treasury yields after the US Treasury unexpectedly doubled planned long-dated bond buybacks, although still-elevated US yields and renewed Middle East tensions are limiting the scale of the move. | ||
| AUDUSD: technical overview | ||
| There are signs of the formation of a longer-term base with the market recovering out from a meaningful longer-term support zone. The latest monthly close back above 0.7000 takes the big picture pressure off the downside and strengthens the case for a bottom, with the focus now on a push towards 0.8000. Setbacks should now be well supported ahead of 0.6700. | ||
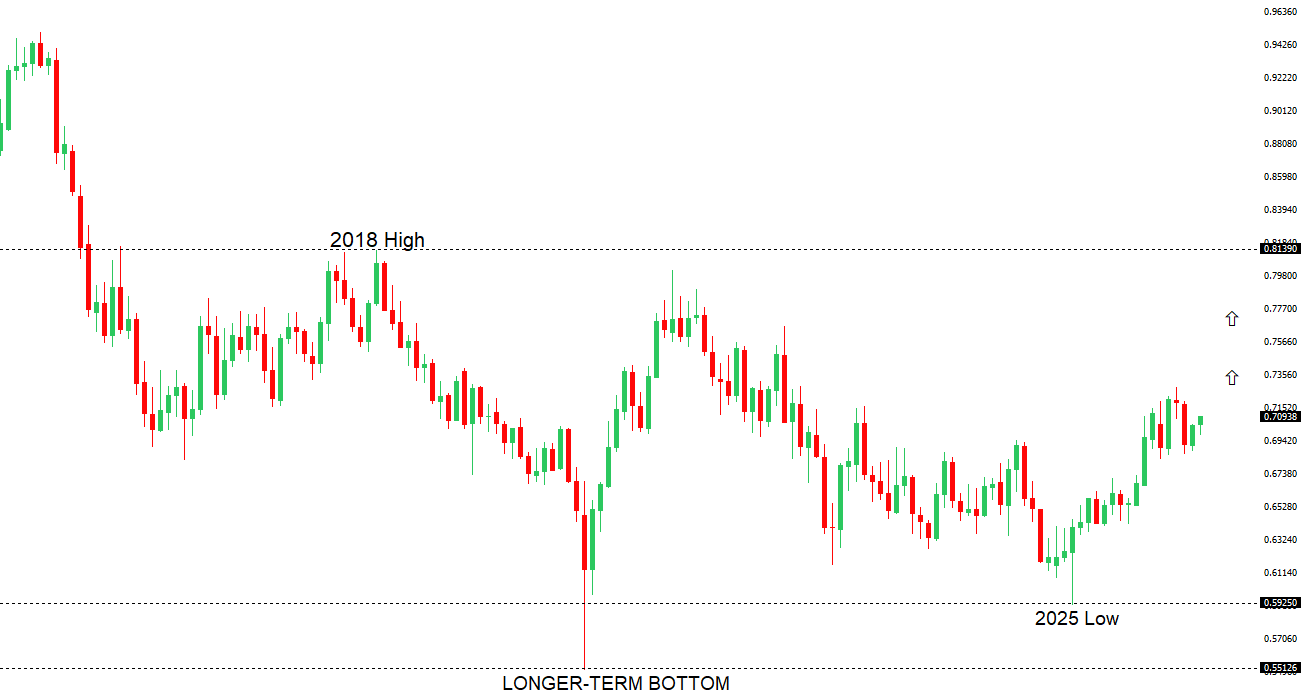 | ||
| R2 0.7201 - 29 May high - Strong R1 0.7181 - 21 August high - Medium S1 0.7067 - 19 August low - Medium S2 0.6984 - 3 August low - Strong | ||
| AUDUSD: fundamental overview | ||
| The Australian Dollar has pushed higher, although the move has been driven primarily by broad US Dollar weakness after the Treasury’s expanded long-dated bond-buyback plans raised concerns about intervention in the bond market and the credibility of US fiscal policy. Domestically, the backdrop is less supportive: Australian employment unexpectedly fell by 15,800 in July, unemployment rose to 4.5%, and hours worked declined, cooling expectations for another near-term RBA rate hike even as inflation remains above target. The RBA has kept rates at 4.35% after delivering 75 basis points of tightening this year, leaving the Aussie sensitive to Tuesday’s meeting minutes and Thursday’s July CPI report for guidance on whether further tightening remains likely. Escalating US-Iran tensions could meanwhile limit AUD gains by encouraging safe-haven demand and weakening broader risk appetite. | ||
| Suggested reading | ||
| The Next Hot Real Estate Investment Market, C. Mellow, Barron’s (August 20, 2026) Sports Gambling Has Finally Gone Too Far, A. Silberling, TechCrunch (August 19, 2026) | ||