


 | ||
| 4th November 2026 | view in browser | ||
| Washington counts, Wall Street discounts | ||
| US equity futures, the dollar and Treasury yields are all lower into Wednesday as early Democratic gains in the midterms raise the prospect of gridlock in Washington. | ||
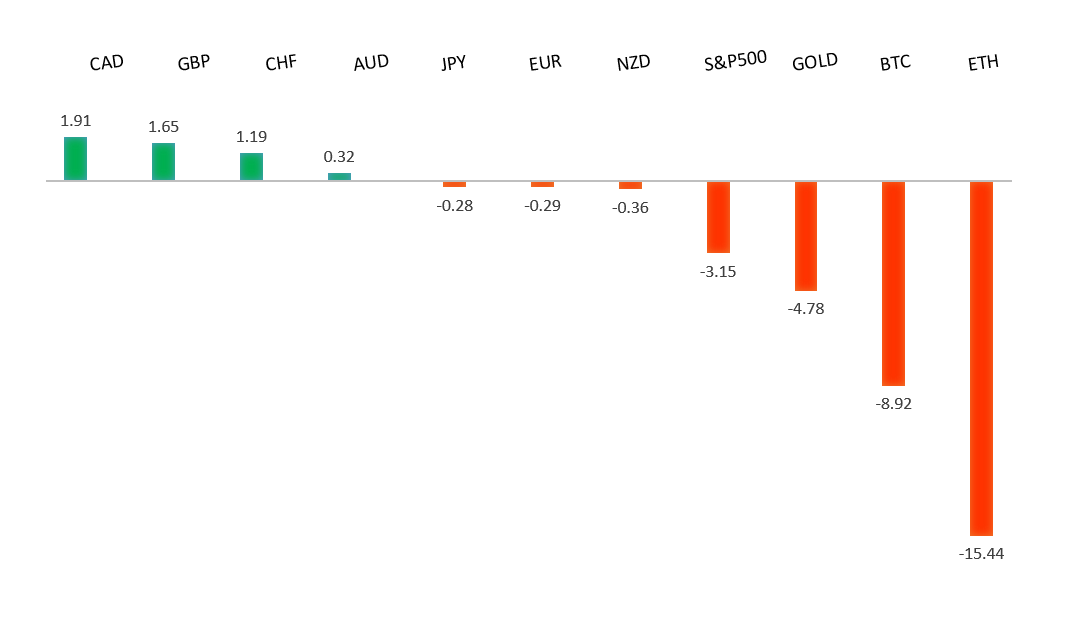
| Performance chart 30day v. USD (%) | ||
 | ||
| Technical & fundamental highlights | ||
| EURUSD: technical overview | ||
| The Euro continues to show signs of wanting to carve out a major bottom after trading down to a 20-year low in 2022. Setbacks should be exceptionally well supported above 1.1000 on a weekly close basis ahead of the next major upside extension back above 1.2000. | ||
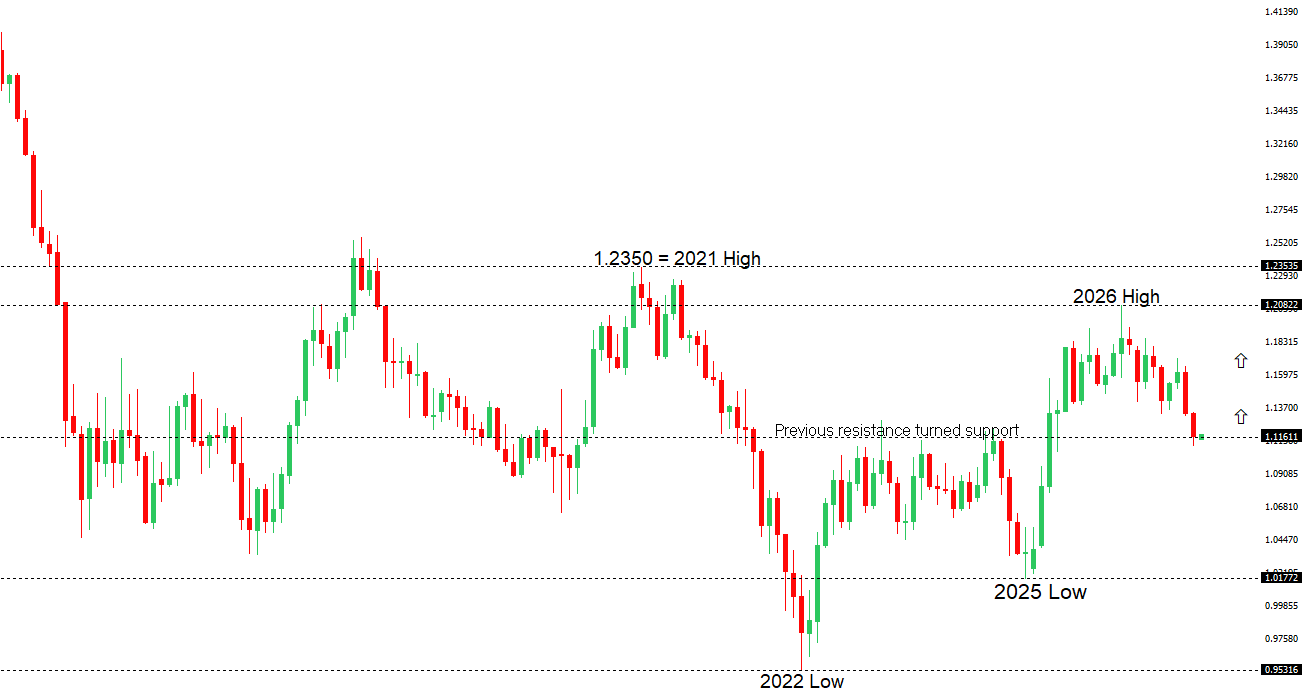 | ||
| R2 1.1337 - 1 October high - Medium R1 1.1270 - 16 October high - Strong S1 1.1136 - 30 October low - Medium S2 1.1104 - 29 October/2026 low - Strong | ||
| EURUSD: fundamental overview | ||
| The euro has pushed back above 1.12 as the dollar comes under pressure following the US midterms. The euro is also drawing support from hawkish ECB commentary after last week’s pause, with Joachim Nagel saying a December hike will likely be needed and Dimitar Radev keeping the door open to further tightening. European gas and power prices remain elevated despite the recent pullback in crude, reinforcing the ECB’s concern that higher energy costs could feed into broader inflation. US election results are the immediate focus, with September payrolls later this week the next test for Fed rate expectations and the dollar. | ||
| GBPUSD: technical overview | ||
| The Pound remains exceptionally well supported on dips into the 1.3000 area, with the price largely consolidating above the psychological barrier and previous resistance turned support in the form of the 2023 high. Look for the market to continue be well supported on dips ahead of the next major upside extension through the yearly high at 1.3870 and towards a retest of the 2018 high at 1.4377 further up. Only a monthly close below 1.3000 negates. | ||
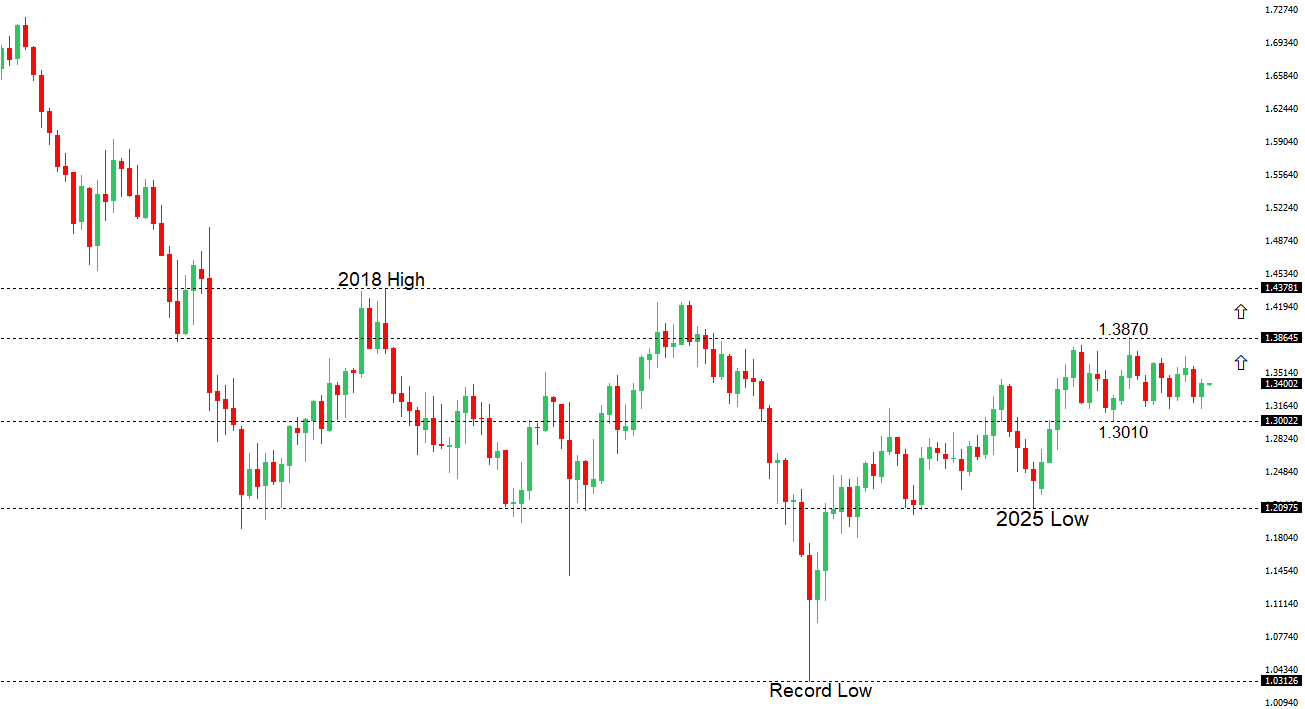 | ||
| R2 1.3498 - 16 September high - Medium R1 1.3479 - 4 November high - Medium S1 1.3339 - 28 October high - Medium S2 1.3272 - 28 October low - Strong | ||
| GBPUSD: fundamental overview | ||
| Sterling climbed to its strongest level against the dollar since mid-September, with the rally driven mainly by broad dollar weakness as early US midterm results raised the prospect of gridlock in Washington and Treasury yields moved lower. Hopes for a diplomatic breakthrough with Iran also reduced demand for the dollar as a haven. On the UK side, easing fiscal concerns and expectations of a Bank of England rate hike on Thursday gave the pound additional support. Stronger-than-expected US job openings kept the case for further Fed tightening intact but did little to slow the dollar’s decline. US ADP employment and ISM services are the next tests for the move, ahead of Thursday’s BoE decision and Friday’s US payrolls. | ||
| USDJPY: technical overview | ||
| The recent breakdown below 155.00 suggests the market could be on the verge of a bigger structural shift, with the possibility for an end to a longer-term uptrend and the start to a period of persistent weakness. Critical support now comes in the form of the 2026 low from January at 151.97, with a drop below to strengthen the bearish outlook and open the door for a major downside extension targeting the 2024 low at 139.58. The market would need to get back above 160.00 to take the immediate pressure off the downside. | ||
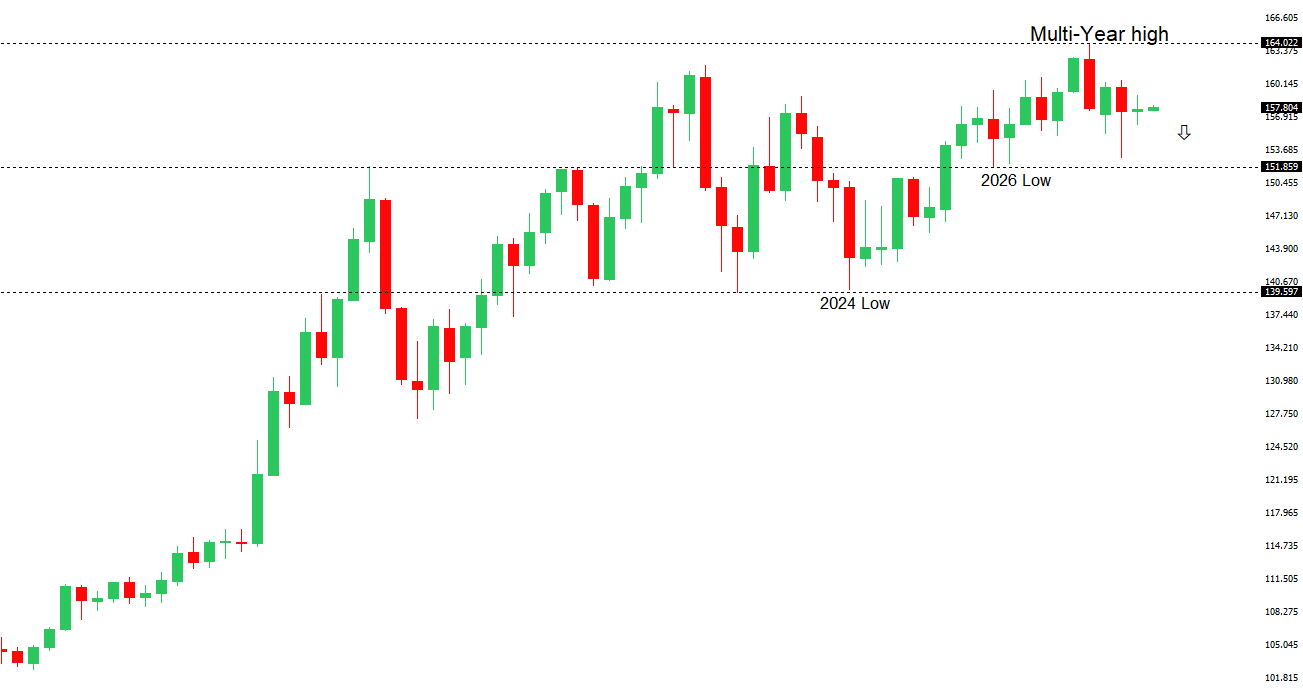 | ||
| R2 159.04 - 24 September high - Strong R1 158.77 - 3 November high - Medium S1 156.96 - 30 October low - Medium S2 156.07 - 23 October low - Strong | ||
| USDJPY: fundamental overview | ||
| The yen has rebounded from a three-week low as renewed intervention warnings from Tokyo prompted traders to cover short positions and the dollar weakened broadly. Japan’s finance minister reiterated that authorities were prepared to act against disorderly currency moves, while lower Treasury yields as US midterm results rolled in and hopes for a diplomatic breakthrough with Iran weighed on the greenback. The wide US–Japan rate gap still limits the yen’s upside, particularly after stronger-than-expected US job openings reinforced expectations for a December Fed hike. The ADP employment report and ISM services survey are the next tests for Treasury yields and USDJPY. | ||
| AUDUSD: technical overview | ||
| There are signs of the formation of a longer-term base with the market recovering out from a meaningful longer-term support zone. The latest monthly close back above 0.7000 takes the big picture pressure off the downside and strengthens the case for a bottom, with the focus now on a push towards 0.8000. Setbacks should now be well supported ahead of 0.6700. | ||
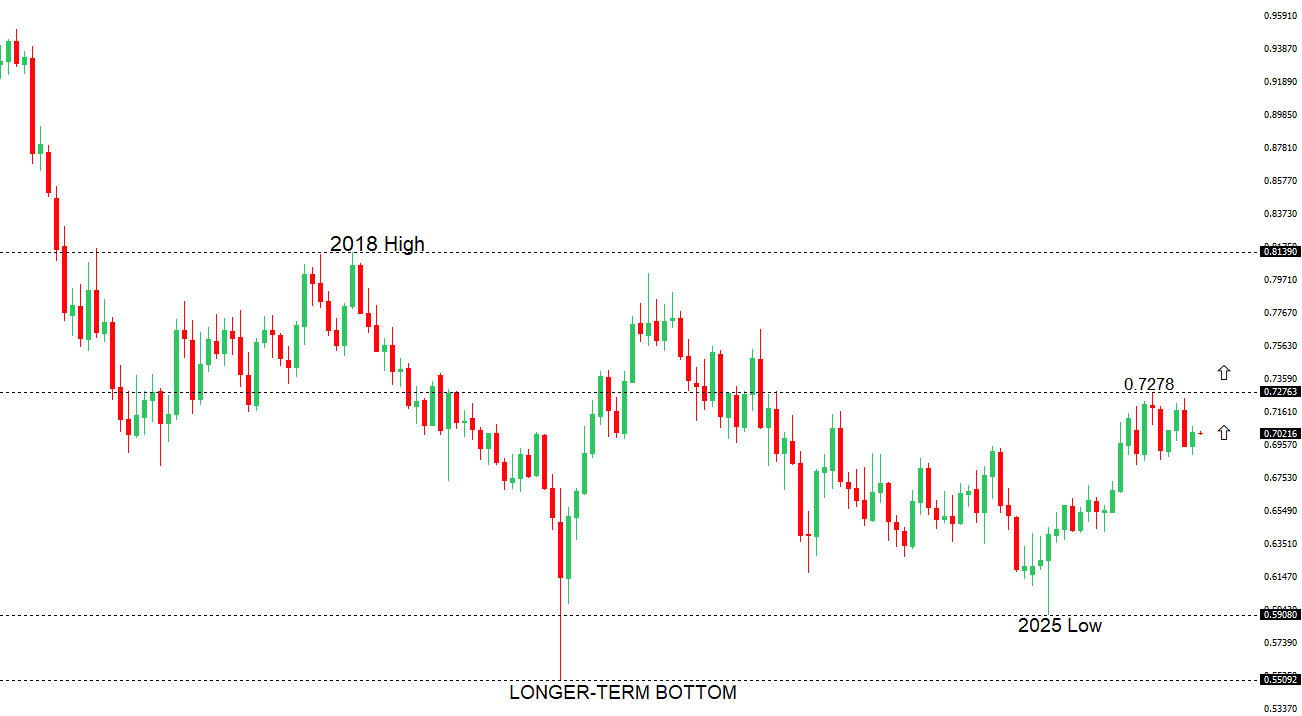 | ||
| R2 0.7100 - Figure - Medium R1 0.7068 - 29 October high - Medium S1 0.6954 - 4 November low - Medium S2 0.6894 - 15 October low - Strong | ||
| AUDUSD: fundamental overview | ||
| The Australian dollar rebounded after two days of losses, helped by broad US dollar weakness and lower Treasury yields as US midterm results came in. The RBA’s quarter-point hike to 4.85% offered some support, though the split vote and lack of a clear signal of further tightening limited the lift. Australia’s services and composite PMIs beat expectations but both slipped into contraction in October, while China’s services PMI eased to 50.8, pointing to slower expansion in Australia’s largest trading partner. With Iran peace talks still stalled, the Aussie remains sensitive to swings in global risk appetite. | ||
| Suggested reading | ||
| Poll Shows Investors as Divided as America, P. La Monica, Barron’s (November 1, 2026) Why nuclear power could be key to colonizing the Moon, C. Cookson, Financial Times (November 3, 2026) | ||