


Special report: BOE and Fed decision preview
Today’s report: A case of event risk position squaring
The story into Thursday is a story of profit taking and position adjusting. Indeed, we are coming out of a wild session of trade which saw the US Dollar rocket higher on the back of the news of the red sweep for the Republican party in the US election.
Wake-up call
- tariff fears
- rate decisions
- Fed meeting
- record stocks
- Ivey PMIs
- position squaring
- accommodative policy
- Macro themes
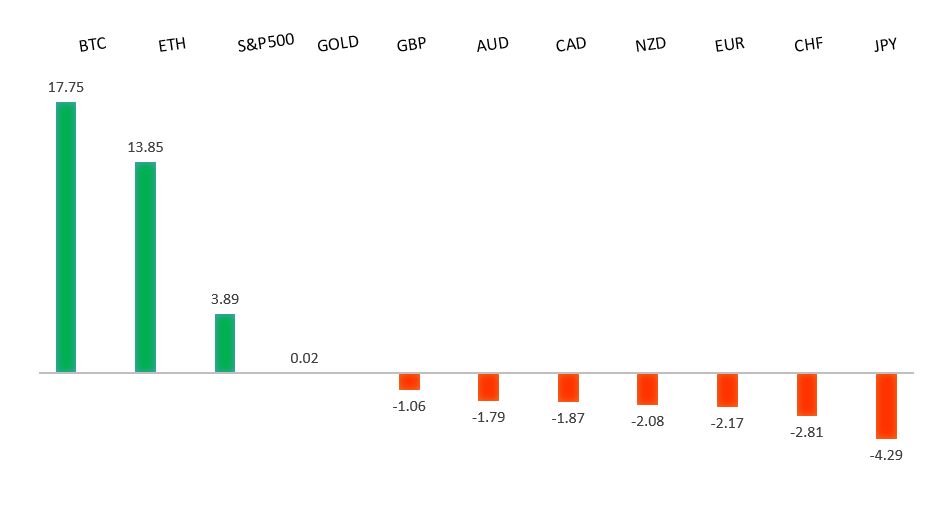
Peformance chart: 30-Day Performance vs. US dollar (%)
Suggested reading
- Slaying Some Passive Investing Dragons, R. Wigglesworth, Financial Times (November 4, 2024)
- Bloated Balance Sheets in Japan, N. Ito, Verdad (November 4, 2024)
Chart talk: Technical & fundamental highlights
Choose pair:
EURUSD – technical overview
The Euro has been in a multi-month consolidation since bottoming out in 2022. Setbacks have since been exceptionally well supported on dips below 1.0500, with a higher platform sought out ahead of the next major upside extension. Look for a push through the 2023 high at 1.1276 to strengthen the constructive outlook and extend the recovery run towards 1.2000. Only back below 1.0400 negates.EURUSD – fundamental overview
The Euro is suffering from a little fear and panic as it contends with the possibility for another struggle during a Trump presidency. The threat of more tariffs with the new administration has opened a round of intense setbacks though we have seen some demand into the dip on solid Euro area data and on profit taking ahead of today's Fed decision. Key standouts on Thursday’s calendar come from Eurozone industrial production, German trade, German industrial production, Eurozone construction PMIs, Eurozone retail sales, ECB speak, the BOE policy decision, US initial jobless claims, and the Fed policy decision.EURUSD - Technical charts in detail
GBPUSD – technical overview
Signs have emerged of the market wanting to put in a longer-term base after collapsing to a record low in September 2022. The door is now open for the next major upside extension towards the 2018 high at 1.4377. Any setbacks should be well supported ahead of 1.2500.GBPUSD – fundamental overview
The Pound has held up relatively well when compared to setbacks in the Euro and Yen post Trump victory. Most of the fallout from the UK budget has been priced and we're also seeing profit taking on GBP shorts ahead of today's BOE and Fed event risk. Key standouts on Thursday’s calendar come from Eurozone industrial production, German trade, German industrial production, Eurozone construction PMIs, Eurozone retail sales, ECB speak, the BOE policy decision, US initial jobless claims, and the Fed policy decision.USDJPY – technical overview
The market is looking to resume the longer-term uptrend after an intense correction in 2024. A higher low is ideally sought out above 140.00 in favor of a bullish continuation. A weekly close back above 150.00 will hint at the start to longer-term uptrend resumption.USDJPY – fundamental overview
Price action is all about the US election results with the Yen selling off hard on the news of a Trump presidency. We have however seen some Yen demand into Thursday on chatter of possible MOF intervention and on positioning ahead of today's Fed decision. Key standouts on Thursday’s calendar come from Eurozone industrial production, German trade, German industrial production, Eurozone construction PMIs, Eurozone retail sales, ECB speak, the BOE policy decision, US initial jobless claims, and the Fed policy decision.AUDUSD – technical overview
There are signs of the potential formation of a longer-term base with the market trading down into a meaningful longer-term support zone. Only a monthly close below 0.6200 would give reason for rethink. A monthly close back above 0.7000 will take the big picture pressure off the downside and strengthen case for a bottom.AUDUSD – fundamental overview
The Australian Dollar has done an outstanding job recovering amidst a wave of intense Dollar demand on the Trump victory. The price action can be reconciled by the fact that the risk correlated Australian Dollar has seen offsetting positive flow from record high US equities. We're also seeing some US Dollar selling ahead of today's Fed decision. Earlier today, Aussie trade data came out and didn't factor into price action. Key standouts on Thursday’s calendar come from Eurozone industrial production, German trade, German industrial production, Eurozone construction PMIs, Eurozone retail sales, ECB speak, the BOE policy decision, US initial jobless claims, and the Fed policy decision.USDCAD – technical overview
A sustained hold above 1.3000 over the past several months signals an end to a period of longer-term bearish consolidation and suggests the market is in the process of carving out a more significant longer-term base. Next key resistance now comes in up into the 1.4000 area, with a break to open a retest of the 2020 high just ahead of 1.4700. Setbacks should be very well supported down into the 1.3000 area.USDCAD – fundamental overview
Price action is all about the US election results, with the Canadian Dollar selling off hard on the expectation for a Trump presidency. At the same time, we have seen some renewed demand for the Canadian Dollar into Thursday, mostly on profit taking ahead of the Fed decision. Key standouts on Thursday’s calendar come from Eurozone industrial production, German trade, German industrial production, Eurozone construction PMIs, Eurozone retail sales, ECB speak, the BOE policy decision, US initial jobless claims, and the Fed policy decision.NZDUSD – technical overview
Overall pressure remains on the downside with the market continuing to stall out on runs up into the 0.6500 area. At the same time, there are some signs of the market wanting to put in a longer-term base. Ultimately, a break back above 0.6500 would be required to take the medium-term pressure off the downside and encourage this prospect. A monthly close below 0.5800 will intensify bearish price action.NZDUSD – fundamental overview
We've seen mostly offsetting flow in the New Zealand Dollar given setbacks from the Dollar bullish implication of a Trump presidency and demand from the surge in US equities to record highs. We're left looking at additional demand into Thursday as the market looks to book profit on US Dollar longs ahead of the Fed decision. Key standouts on Thursday’s calendar come from Eurozone industrial production, German trade, German industrial production, Eurozone construction PMIs, Eurozone retail sales, ECB speak, the BOE policy decision, US initial jobless claims, and the Fed policy decision.US SPX 500 – technical overview
The longer term uptrend remains intact and dips continue to be exceptionally well supported. Critical support comes in at 5697, with only a break back below this level to compromise the structure and open the door for a more significant corrective decline. Until then, the focus remains on a continued push to fresh record highs.US SPX 500 – fundamental overview
The US equities market remains exceptionally well supported in 2024 on the back of an ongoing expectation for more rate cuts than less going forward. Investors are feeling better about a soft landing in the US economy and this has also been accompanied by an accommodative adjustment of Fed policy. It will however be important to keep an eye on inflation, bigger picture economic data, and geopolitical risk in the weeks and months ahead.GOLD (SPOT) – technical overview
The 2019 breakout above the 2016 high at 1375 was a significant development, opening the door for fresh record highs and this next major upside extension into the 3000 area. Setbacks should now be well supported above 2500 on a monthly close basis.GOLD (SPOT) – fundamental overview
The yellow metal has pushed record highs in 2024 with solid demand from medium and longer-term accounts. These players are more concerned about inflation, geopolitical risk and a less upbeat global growth outlook. All of this should keep the commodity well supported over the coming months.