


Next 24 hours: The collapsing Yen and an uneventful event
Today’s report: A growing disconnect
There has been a concerning trend in 2022 that is disrupting markets. That trend is the trend of rising inflation. What’s so interesting about this trend is the fact that we aren’t seeing the type of across the board response as we once had.
Wake-up call
- Bund auction
- Pound worries
- treasury holdings
- Downbeat outlook
- hot inflation
- against peers
- Inflation headache
- Dealers report
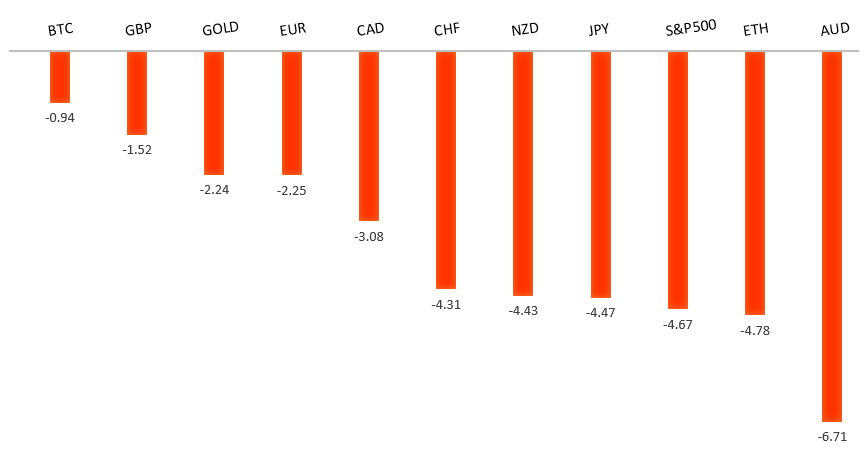
Peformance chart: 30 Day Performance vs. US dollar (%)
Suggested reading
- The BOE Must Make Halloween Less Terrifying, M. Ashworth, Bloomberg (October 19, 2022)
- Warren’s way: behind Buffett’s buying spree, E. Platt, Financial Times (October 20, 2022)
Chart talk: Technical & fundamental highlights
Choose pair:
EURUSD – technical overview
Technical studies are turning up from oversold territory, suggesting additional setbacks should be limited in favour of some form of a meaningful correction and consolidation. A weekly close back above parity will take the immediate pressure off the downside.EURUSD – fundamental overview
The recent weak Bund auction has rattled Euro sentiment, and the latest inflation data out of the zone has come and gone without much attention. Key standouts on today’s calendar come from German producer prices, the Eurozone current account, US initial jobless claims, the Philly Fed, existing home sales, and some Fed speak.EURUSD - Technical charts in detail
GBPUSD – technical overview
Signs have emerged of the market wanting to put in a longer-term base after collapsing to a record low in September. A break above the September high at 1.1739 will solidify the recovery. Until then, look for setbacks to be well supported ahead of 1.0800.GBPUSD – fundamental overview
The Pound was under pressure on Wednesday, this after UK inflation data came in hot. The worry of higher inflation and a central bank leaning on the accommodative side is a worry that has not been kind to the Pound. Key standouts on today’s calendar come from German producer prices, the Eurozone current account, US initial jobless claims, the Philly Fed, existing home sales, and some Fed speak.USDJPY – technical overview
Technical studies are looking quite stretched on the longer-term chart, warning of consolidation and correction in the days and weeks ahead. Look for additional upside from here to be well capped on rallies above 150.00. Next key support comes in at 143.52.USDJPY – fundamental overview
The Yen has extended declines to fresh multi-year low levels, sinking below pre-intervention levels from September to its lowest levels since 1990. Policy divergence continues to be a big deal here, with yields moving more and more in the US Dollar's favour. Japanese holdings of US Treasuries are now at three-year low, reflecting moves to sell bonds for currency intervention. Key standouts on today’s calendar come from German producer prices, the Eurozone current account, US initial jobless claims, the Philly Fed, existing home sales, and some Fed speak.AUDUSD – technical overview
Overall pressure remains on the downside with the market confined to a well defined downtrend. A break back above 0.6682 would be required to take the pressure off the downside. Until then, scope exists for deeper setbacks towards 0.6000.AUDUSD – fundamental overview
Downbeat growth calls from Westpac, a weaker overall growth outlook and a downturn in global sentiment have all been weighing on Aussie into Thursday. Aussie employment data didn't get much attention, as expected on the whole. We did however see some disappointment from the employment change front. Key standouts on today’s calendar come from German producer prices, the Eurozone current account, US initial jobless claims, the Philly Fed, existing home sales, and some Fed speak.USDCAD – technical overview
A recent surge back above 1.3000 signals an end to a period of bearish consolidation and suggests the market is in the process of carving out a more significant longer-term base. Next key resistance now comes in up into the 1.4000 area. Setbacks should be very well supported down into the 1.3000 area.USDCAD – fundamental overview
The Canadian Dollar was lower on Wednesday, this despite a hotter than forecast Canada inflation release. It seems as though the market is worried about whether the Bank of Canada will be as aggressive in its response to rising inflation given a struggling economy. Key standouts on today’s calendar come from German producer prices, the Eurozone current account, US initial jobless claims, the Philly Fed, existing home sales, and some Fed speak.NZDUSD – technical overview
Overall pressure remains on the downside with the focus on a retest of the critical low from 2020 at 0.5469. A break back above 0.5814 would be required to take the immediate pressure off the downside.NZDUSD – fundamental overview
The New Zealand Dollar has come back under some pressure on another downturn in sentiment, but has managed to outperform its peers after New Zealand inflation readings came in well above forecast earlier this week, fueling speculation the RBNZ would be more hawkish. Key standouts on today’s calendar come from German producer prices, the Eurozone current account, US initial jobless claims, the Philly Fed, existing home sales, and some Fed speak.US SPX 500 – technical overview
Longer-term technical studies are in the process of unwinding from extended readings off record highs. Look for rallies to be well capped in favor of lower tops and lower lows. Back above 3808 will be required at a minimum to take the immediate pressure off the downside. Next major support comes in around 3200.US SPX 500 – fundamental overview
We've finally reached a point in the cycle where the Fed recognizes unanchored inflation expectations pose a greater downside risk than over-tightening. This is significant, as it means less investor friendly monetary policy that risks potential recession in the months ahead. Overall, we expect inflation to continue to be a problem in 2022 that results in downside pressure into rallies.GOLD (SPOT) – technical overview
The 2019 breakout above the 2016 high at 1375 was a significant development, opening the door for fresh record highs. Setbacks should now be well supported above 1600 on a monthly close basis ahead of the next major upside extension.GOLD (SPOT) – fundamental overview
The yellow metal continues to be well supported on dips with solid demand from medium and longer-term accounts. These players are more concerned about inflation risk and a less upbeat global growth outlook. All of this should keep the commodity well supported, with many market participants also fleeing to the hard asset as the grand dichotomy of record high equities and record low yields comes to an unnerving climax.