


Next 24 hours: Geopolitical risk creeps back in
Today’s report: A repricing of expectations
A lot of what we’ve been seeing in markets over the past few sessions is a repricing of Fed expectations, along with a repricing of expectations at other major central banks. All of this repricing has been a net positive for currencies against the Buck and a net positive for US equities.
Wake-up call
- 50bp hike
- BOE Bailey
- Fed expectations
- RBA Minutes
- oil recovery
- global sentiment
- Stocks vulnerable
- Dealers report
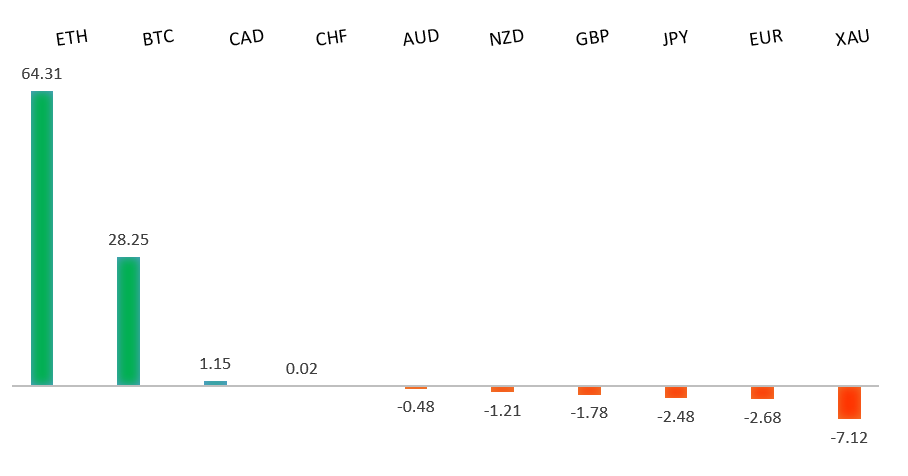
Peformance chart: 30 Day Performance vs. US dollar (%)
Suggested reading
- Dollar Bulls Are Looking Increasingly Like a Cult, J. Dillian, Bloomberg (July 19, 2022)
- How Do You Actually Rewild a Property?, L. Hook, Financial Times (July 17, 2022)
Chart talk: Technical & fundamental highlights
Choose pair:
EURUSD – technical overview
The market has come under intense pressure in recent months, with setbacks accelerating below the critical multi-year low from 2017 at 1.0340. This sets up a test of monumental support in the form of parity. At the same time, technical studies are tracking in oversold territory, suggesting additional setbacks should be limited. Back above 1.0500 would be required to take the immediate pressure off the downside.EURUSD – fundamental overview
Plenty of reports swirling about with respect to speculation around Thursday's ECB decision. The market has been hearing chatter of a 50 basis point hike from the central bank, which has been behind a lot of this recent drive higher in the single currency. Key standouts on today’s calendar come from German producer prices, UK inflation, the Eurozone current account, Canada inflation, Eurozone consumer confidence, and US existing home sales.EURUSD - Technical charts in detail
GBPUSD – technical overview
The market continues to be exceptionally well supported on dips below 1.2000. Unless we see a monthly close below 1.2000, we expect this to continue to be the case. Look for a break back above 1.2200 to take the immediate pressure off the downside.GBPUSD – fundamental overview
BOE Bailey has said a 50 basis point rate hike is on the table for the August meeting, and the Pound has rallied as a consequence. Key standouts on today’s calendar come from German producer prices, UK inflation, the Eurozone current account, Canada inflation, Eurozone consumer confidence, and US existing home sales.USDJPY – technical overview
The market has rocketed higher to its highest levels since 1998 after breaking through the 2002 high. Technical studies are however looking stretched, with scope for a sizable consolidation and correction in the weeks ahead. Look for additional upside from here to be well capped ahead of 140.00. A break back below 134.00 would take the immediate pressure off the topside.USDJPY – fundamental overview
We've seen some mild demand for the Yen in recent sessions. Most of this price action comes from position adjusting from shorter-term accounts in the aftermath of a massive decline in the Yen. There has also been a round of position adjusting in favor of the Yen as the market prices out the odds for a 100 basis point rate hike from the Fed. Key standouts on today’s calendar come from German producer prices, UK inflation, the Eurozone current account, Canada inflation, Eurozone consumer confidence, and US existing home sales.AUDUSD – technical overview
Overall pressure remains on the downside and conditions remain quite choppy. A break back above 0.7070 would be required at a minimum to take the immediate pressure off the downside. Until then, scope exists for deeper setbacks towards 0.6500.AUDUSD – fundamental overview
A hawkish RBA Minutes and resurgence in risk appetite have been behind this latest run higher in the Australian Dollar. Key standouts on today’s calendar come from German producer prices, UK inflation, the Eurozone current account, Canada inflation, Eurozone consumer confidence, and US existing home sales.USDCAD – technical overview
A recent surge back above 1.3000 signals an end to a period of bearish consolidation and suggests the market is in the process of carving out a more significant longer-term base. Next key resistance now comes in up into the 1.3500 area. Setbacks should be very well supported down into the 1.2500 area.USDCAD – fundamental overview
Demand for the Canadian Dollar has come back in recent sessions, this on the back of a jump in US equities, broad based selling of the US Dollar, and a recovery in the price of oil. Key standouts on today’s calendar come from German producer prices, UK inflation, the Eurozone current account, Canada inflation, Eurozone consumer confidence, and US existing home sales.NZDUSD – technical overview
Overall pressure remains on the downside and conditions remain quite choppy. A break back above 0.6400 would be required to force a shift in the structure and suggest we are seeing a more significant bullish reversal. Until then, scope exists for fresh yearly lows and a retest of the major psychological barrier at 0.6000.NZDUSD – fundamental overview
The New Zealand Dollar has been in minor recovery mode in recent sessions, getting a boost out from the yearly low on account of a bounce in US equities, broad based declines in the US Dollar, and hot inflation data out of New Zealand. Key standouts on today’s calendar come from German producer prices, UK inflation, the Eurozone current account, Canada inflation, Eurozone consumer confidence, and US existing home sales.US SPX 500 – technical overview
Longer-term technical studies are in the process of unwinding from extended readings off record highs. Look for rallies to be well capped in favor of lower tops and lower lows. Back above 4,206 will be required at a minimum to take the immediate pressure off the downside. Next major support comes in around 3,400.US SPX 500 – fundamental overview
We've finally reached a point in the cycle where the Fed recognizes unanchored inflation expectations pose a greater downside risk than over-tightening. This is significant, as it means less investor friendly monetary policy that risks potential recession in the months ahead. And so, naturally, stocks have been under intense pressure in 2022.GOLD (SPOT) – technical overview
The 2019 breakout above the 2016 high at 1375 was a significant development, opening the door for fresh record highs. Setbacks should now be well supported above 1700 on a monthly close basis.GOLD (SPOT) – fundamental overview
The yellow metal continues to be well supported on dips with solid demand from medium and longer-term accounts. These players are more concerned about inflation risk and a less upbeat global growth outlook. All of this should keep the commodity well supported, with many market participants also fleeing to the hard asset as the grand dichotomy of record high equities and record low yields comes to an unnerving climax.