


Next 24 hours: More worry out of China
Today’s report: Asia Pacific FX taking it hard on the chin
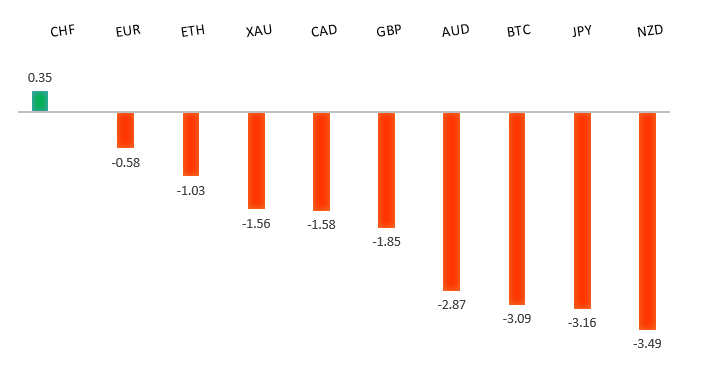
Overall, it has been a story of standout weakness in the Asia Pacific region on account of troubling monetary policy, a broad deterioration in sentiment, and sliding commodities prices. A lot of this has been highlighted by recent weakness in both the Yen and Renminbi, though there has also been clear underperformance in commodity currencies like the Australian and New Zealand Dollars.
Wake-up call
- summer doldrums
- economic data
- BOJ losing
- deteriorating APAC
- peers
- manufacturing PMI
- inflation risk
- Dealers report
Peformance chart: 30 Day Performance vs. US dollar (%)
Suggested reading
- What US Treasury Volatility Means for the Economy, M. El-Erian, Bloomberg (August 7, 2023)
- AI can be a climate warrior, but what about its carbon footprint?, E. Mychasuk, Financial Times (August 2, 2023)
Chart talk: Technical & fundamental highlights
Choose pair:
EURUSD – technical overview
The Euro remains well supported on dips following a run to the topside through 1.1000. Any additional setbacks should be well supported ahead of 1.0500 in favor of a bullish continuation. Ultimately, only a monthly close back below 1.0500 would give reason for concern. Next key resistance comes in the form of the 2023 high at 1.1276.EURUSD – fundamental overview
We haven't seen much in the way of direction for the Euro in recent sessions on account of anemic news flow and summer doldrums trade. Key standouts on Monday’s calendar come from German wholesale prices, and US consumer inflation expectations.EURUSD - Technical charts in detail
GBPUSD – technical overview
Signs have emerged of the market wanting to put in a longer-term base after collapsing to a record low in September 2022. The November 2022 monthly close back above 1.2000 strengthens this prospect. Any setbacks should now be well supported ahead of 1.2500. Next key resistance comes in at 1.3143.GBPUSD – fundamental overview
The Pound outperformed in Friday trade on the back of well received UK economic data. GDP, industrial production and manufacturing production all came in healthy and above expectation overall. Key standouts on Monday’s calendar come from German wholesale prices, and US consumer inflation expectations.USDJPY – technical overview
The major pair has seen a nice recovery following the massive correction out from multi-year highs. Setbacks have finally been well supported ahead of 125.00 in the 127s. At this stage, it looks like the market could be wanting to resume the bigger picture uptrend and head back towards a retest of that multi-year high from October 2022 up at 151.95. Look for any weakness to continue to be well supported on dips. A weekly close back above 145.00 will confirm bullish continuation.USDJPY – fundamental overview
The Bank of Japan is slowly losing the battle to maintain negative interest rate policy in a rising rate environment. This likely means the next currency intervention is likely to be less successful and effective than previous attempts. Key standouts on Monday’s calendar come from German wholesale prices, and US consumer inflation expectations.AUDUSD – technical overview
There are signs of the potential formation of a longer-term base following the late 2022 surge back above 0.6500. Next key resistance comes in at 0.7284. Setbacks should continue to be well supported in the 0.6400-6500 area. Only a monthly close below 0.6500 would give reason for rethink.AUDUSD – fundamental overview
Most of the latest Aussie weakness we've been seeing comes from downside pressure in commodities and stocks, along with a deteriorating APAC FX complex lead by weakness in the Yen and RMB. Key standouts on Monday’s calendar come from German wholesale prices, and US consumer inflation expectations.USDCAD – technical overview
Above 1.3000 signals an end to a period of longer-term bearish consolidation and suggests the market is in the process of carving out a more significant longer-term base. Next key resistance now comes in up into the 1.4000 area. Setbacks should be very well supported down into the 1.3000 area.USDCAD – fundamental overview
The Canadian Dollar remains under pressure on lower stocks and an overall deterioration in sentiment, but has managed to outperform against its commodity currency cousins on account of oil demand and distance from a softer APAC region. Key standouts on Monday’s calendar come from German wholesale prices, and US consumer inflation expectations.NZDUSD – technical overview
Overall pressure remains on the downside with the market once again stalling out on a run up into the 0.6500 area. Ultimately, a break back above 0.6577 would be required to take the immediate pressure off the downside. A monthly close below 0.6000 would intensify bearish price action.NZDUSD – fundamental overview
The New Zealand Dollar has sunk to a fresh yearly low on the back of an ongoing deterioration in sentiment, falling stocks and commodities, and soft New Zealand PMI data. Manufacturing PMIs slumped to a cycle low of 46.3. Key standouts on Monday’s calendar come from German wholesale prices, and US consumer inflation expectations.US SPX 500 – technical overview
Longer-term technical studies are in the process of unwinding from extended readings off record highs. Look for rallies to be well capped in favor of lower tops and lower lows. A monthly close back above 4600 will be required to take the immediate pressure off the downside. Next key support comes in at 4376.US SPX 500 – fundamental overview
We've finally reached a point in the cycle where the Fed recognizes unanchored inflation expectations pose a greater downside risk than over-tightening. This is significant, as it means less investor friendly monetary policy. Overall, we expect inflation to continue to be a problem in 2023 that results in downside pressure into rallies despite market expectations that would argue otherwise.GOLD (SPOT) – technical overview
The 2019 breakout above the 2016 high at 1375 was a significant development, opening the door for fresh record highs. Setbacks should now be well supported above 1600 on a monthly close basis ahead of the next major upside extension. The recent break back above 1808 strengthens the bullish outlook. Next major resistance comes in at 2100, above which opens the next extension towards 2500.GOLD (SPOT) – fundamental overview
The yellow metal continues to be well supported on dips with solid demand from medium and longer-term accounts. These players are more concerned about inflation risk and a less upbeat global growth outlook. All of this should keep the commodity well supported, with many market participants also fleeing to the hard asset as the grand dichotomy of record high equities and record low yields comes to an unnerving climax.