


Special report: FOMC decision preview
Today’s report: Back to peak inflation talk
The narrative has quickly shifted back towards expectations of peak inflation, this after US CPI came out softer than expected on Tuesday. The ensuing price action saw a heavy sell-off in the US Dollar and surge in US equities.
Wake-up call
- industrial production
- UK inflation
- Yield differentials
- risk appetite
- manufacturing sales
- currency run
- Inflation headache
- Dealers report
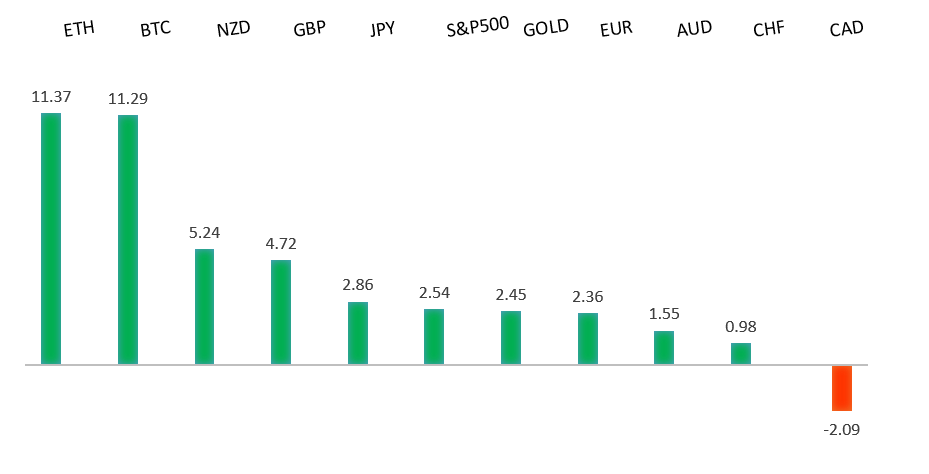
Peformance chart: 30 Day Performance vs. US dollar (%)
Suggested reading
- What Did SBF and FTX Lose in Real Money?, P. Davies, Bloomberg (December 13, 2022)
- China Restraining Russia Over Use of Nuclear Weapons, J. Kynge, Financial Times (December 9, 2022)
Chart talk: Technical & fundamental highlights
Choose pair:
EURUSD – technical overview
The Euro recovery has finally run into meaningful previous support turned resistance at 1.0635. Look for a monthly close back above this level to suggest the market has established a longer-term base. Inability to hold above 1.0635 could open the door for a resumption of declines.EURUSD – fundamental overview
Solid Eurozone data and a softer US CPI report were behind the latest run higher in the single currency, this time, to its highest level against the Buck in 6 months. Key standouts on today’s calendar come from UK inflation, Eurozone industrial production, Canada manufacturing sales, US import and export prices, and the Fed decision late in the day.EURUSD - Technical charts in detail
GBPUSD – technical overview
Signs have emerged of the market wanting to put in a longer-term base after collapsing to a record low in September. The latest weekly close back above the September high at 1.1739 strengthens this prospect. Any setbacks should now be well supported ahead of 1.1100. Next key resistance comes in at 1.2668.GBPUSD – fundamental overview
The Pound wasn't sure what to make of some mixed UK employment data early Tuesday, but managed to eventually run higher on the back of the softer than expected US CPI report. Key standouts on today’s calendar come from UK inflation, Eurozone industrial production, Canada manufacturing sales, US import and export prices, and the Fed decision late in the day.USDJPY – technical overview
Longer-term technical studies are in the process of unwinding from severe overbought readings. Look for additional corrective price action back down towards the 130.00 area before the market considers the possibility of uptrend resumption. Rallies should now be well capped ahead of 140.00.USDJPY – fundamental overview
The Yen was decidedly higher in Tuesday trade, with the currency joining in with the rest of the market rally against the US Dollar in the aftermath of a softer than expected US CPI report. Key standouts on today’s calendar come from UK inflation, Eurozone industrial production, Canada manufacturing sales, US import and export prices, and the Fed decision late in the day.AUDUSD – technical overview
There are signs of the potential formation of a longer-term base following the recent surge back above 0.6500. The latest weekly close back above previous support now turned resistance at 0.6682 strengthens the outlook for a bullish structural shift.AUDUSD – fundamental overview
The Australian Dollar got a nice boost in Tuesday trade, helped along by a surge in risk appetite on the back of the softer US CPI report. Key standouts on today’s calendar come from UK inflation, Eurozone industrial production, Canada manufacturing sales, US import and export prices, and the Fed decision late in the day.USDCAD – technical overview
A recent surge back above 1.3000 signals an end to a period of bearish consolidation and suggests the market is in the process of carving out a more significant longer-term base. Next key resistance now comes in up into the 1.4000 area. Setbacks should be very well supported down into the 1.3000 area.USDCAD – fundamental overview
A softer US inflation print and higher oil were behind the Tuesday recovery in the Canadian Dollar. Key standouts on today’s calendar come from UK inflation, Eurozone industrial production, Canada manufacturing sales, US import and export prices, and the Fed decision late in the day.NZDUSD – technical overview
Overall pressure remains on the downside with risk for the current recovery rally to stall out and form a lower top for the next major downside extension. A break back above 0.6577 would be required to take the immediate pressure off the downside.NZDUSD – fundamental overview
The New Zealand Dollar jumped up to its highest level in 6 months against the US Dollar after US CPI came in below forecast, opening a move in yield differentials back in the New Zealand Dollar's favor. Key standouts on today’s calendar come from UK inflation, Eurozone industrial production, Canada manufacturing sales, US import and export prices, and the Fed decision late in the day.US SPX 500 – technical overview
Longer-term technical studies are in the process of unwinding from extended readings off record highs. Look for rallies to be well capped in favor of lower tops and lower lows. A monthly close back above 4300 will be required at a minimum to take the immediate pressure off the downside. Next major support comes in at 3492.US SPX 500 – fundamental overview
We've finally reached a point in the cycle where the Fed recognizes unanchored inflation expectations pose a greater downside risk than over-tightening. This is significant, as it means less investor friendly monetary policy that risks potential recession in the months ahead. Overall, we expect inflation to continue to be a problem in Q4 2022 and Q1 2023 that results in downside pressure into rallies.GOLD (SPOT) – technical overview
The 2019 breakout above the 2016 high at 1375 was a significant development, opening the door for fresh record highs. Setbacks should now be well supported above 1600 on a monthly close basis ahead of the next major upside extension. This latest break back above 1808 strengthens the bullish outlook.GOLD (SPOT) – fundamental overview
The yellow metal continues to be well supported on dips with solid demand from medium and longer-term accounts. These players are more concerned about inflation risk and a less upbeat global growth outlook. All of this should keep the commodity well supported, with many market participants also fleeing to the hard asset as the grand dichotomy of record high equities and record low yields comes to an unnerving climax.