


Next 24 hours: Risk off intensifies
Today’s report: Ballooning Fed balance sheet ain't doin it
Last week, we got another update on the Fed balance sheet. Assets rose by $91.5 billion to a booming record of $8.45 trillion. And yet, the thing is, we didn’t get the market reaction one has grown accustomed to expecting whenever hearing about an even bigger Fed balance sheet.
Wake-up call
- transitory inflation
- retail sales
- risk-off flow
- sentiment sours
- Canada election
- Soft PMIs
- Stocks vulnerable
- Dealers report
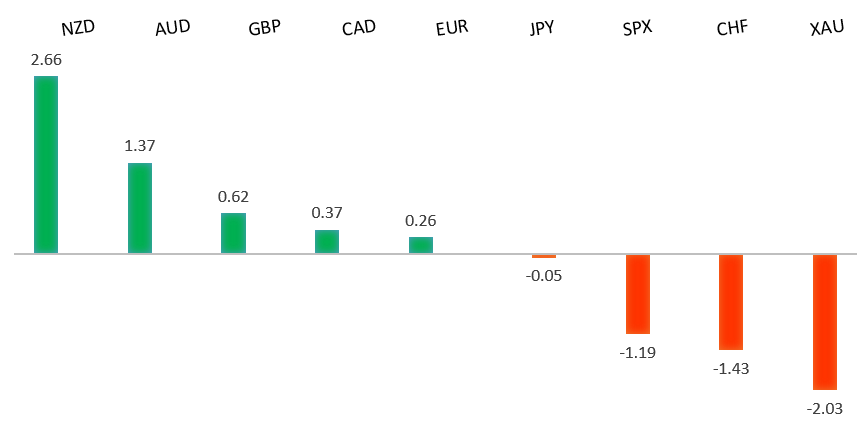
Peformance chart: 30 Day Performance vs. US dollar (%)
Suggested reading
- Winter Is Coming and Europe Is Running Scarily Low on Gas, J. Lee, Bloomberg (September 19, 2021)
- Music festivals: a high-risk business, P. Gioumpasis, AIER (September 17, 2021)
Chart talk: Technical & fundamental highlights
Choose pair:
EURUSD – technical overview
The market has been looking for a higher low since topping out in 2021 up at 1.2350. Ideally, setbacks continue to be well supported down towards 1.1600 in favour of the next major upside extension back through 1.2350 and towards a retest of the 2018 high at 1.2555 further up. Only a weekly close below 1.1600 would force a rethink.EURUSD – fundamental overview
The Euro remains under pressure on account of broad based Dollar demand from risk off flow. We've also seen selling after the FT's ECB inflation story amounted to nothing. The ECB still maintains any inflation is viewed as transitory. Key standouts on today’s calendar come in the form of German producer prices, US NAHB housing, and the Canada general election.EURUSD - Technical charts in detail
GBPUSD – technical overview
The market is in a consolidation phase in the aftermath of the run to fresh 2021 and multi-month highs. At this stage, additional setbacks should be limited to the 1.3500 area ahead of the next major upside extension towards a retest and break of critical resistance in the form of the 2018 high.GBPUSD – fundamental overview
The Pound took a big shot at the end of last week on the back of the much softer than expected UK retail sales print. We've also seen selling on broad based US Dollar demand from risk off flow. Key standouts on today’s calendar come in the form of German producer prices, US NAHB housing, and the Canada general election.USDJPY – technical overview
The longer-term trend is bearish despite the recent run higher. Look for additional upside to be limited, with scope for a topside failure and bearish resumption back down towards the 100.00 area. It would take a clear break back above 113.00 to negate the outlook.USDJPY – fundamental overview
The Yen hasn't really gone anywhere in recent trade, though we have seen Yen selling despite some intense risk off flow. It seems the market is more focused on the wave of broad based US Dollar demand at the moment. Key standouts on today’s calendar come in the form of German producer prices, US NAHB housing, and the Canada general election.AUDUSD – technical overview
The Australian Dollar has been in the process of a healthy correction following the impressive run towards a retest of the 2018 high earlier this year. At this stage, there is risk for additional declines, though setbacks are expected to be well supported down into the 0.7000 area. Look for a weekly close above 0.7500 to force a shift in the structure.AUDUSD – fundamental overview
Most of the selling in the Australian Dollar we've been seeing has come from the slide in commodities prices and US equities. Key standouts on today’s calendar come in the form of German producer prices, US NAHB housing, and the Canada general election.USDCAD – technical overview
Finally signs of a major bottom in the works after a severe decline from the 2020 high. A recent weekly close back above 1.2500 encourages the constructive outlook and opens the door for a push back towards next critical resistance in the 1.3000 area. Any setbacks should be well supported into the 1.2200s.USDCAD – fundamental overview
The Canadian Dollar has taken quite the hit on the commodities decline and downturn in US equities. Key standouts on today’s calendar come in the form of German producer prices, US NAHB housing, and the Canada general election.NZDUSD – technical overview
The market has entered a period of consolidation after running up to a yearly and multi-month high. At this stage, rallies should be well capped and there is still room for deeper setbacks into the 0.6500-0.6800 area before we see an attempt at a higher low and resumption of upside pressure. Back above the April high at 0.7317 would be required to force a shift in the structure.NZDUSD – fundamental overview
The New Zealand Dollar has held up well overall, but has seen some selling in recent sessions on account of risk off flow, a downturn in commodities prices and some softer New Zealand manufacturing PMI reads. Key standouts on today’s calendar come in the form of German producer prices, US NAHB housing, and the Canada general election.US SPX 500 – technical overview
Longer-term technical studies are looking quite exhausted and the market is showing signs of wanting to roll over after racing to another record high. Look for rallies to be well capped ahead of 4600, with a break back below 4353 to strengthen the outlook.US SPX 500 – fundamental overview
We're trading just off fresh record highs, and yet, with so little room for additional central bank accommodation, given an already depressed interest rate environment, the prospect for sustainable runs to the topside on easy money policy incentives and government stimulus, should no longer be as enticing to investors. Meanwhile, ongoing worry associated with coronavirus fallout and risk of rising inflation should weigh more heavily on investor sentiment into this second half of 2021.GOLD (SPOT) – technical overview
The 2019 breakout above the 2016 high at 1375 was a significant development, opening the door for fresh record highs and an acceleration beyond the next major psychological barrier at 2000. Setbacks should now be well supported above 1600.GOLD (SPOT) – fundamental overview
The yellow metal continues to be well supported on dips with solid demand from medium and longer-term accounts. These players are more concerned about exhausted monetary policy, extended global equities, and coronavirus fallout. All of this should keep the commodity well supported, with many market participants also fleeing to the hard asset as the grand dichotomy of record high equities and record low yields comes to an unnerving climax. [audio mp3="https://www.lmax.com/blog/wp-content/uploads/sites/4/2021/09/15seplmaxaudio.mp3"][/audio]