


Special report: Fed Minutes Preview
Today’s report: BOE moves more unsettling than not
The BOE’s actions to widen its Gilt buying program has been both comforting and unsettling for financial markets. Comforting because it arguably provides temporary stability to the bond market while removing systemic risk, and unsettling because it could open the door to more needed action at a time where central banks don’t really have the flexibility to be moving in this direction.
Wake-up call
- debt scheme
- financial stability
- policy divergence
- Soft data
- housing headlines
- card spending
- Inflation headache
- Dealers report
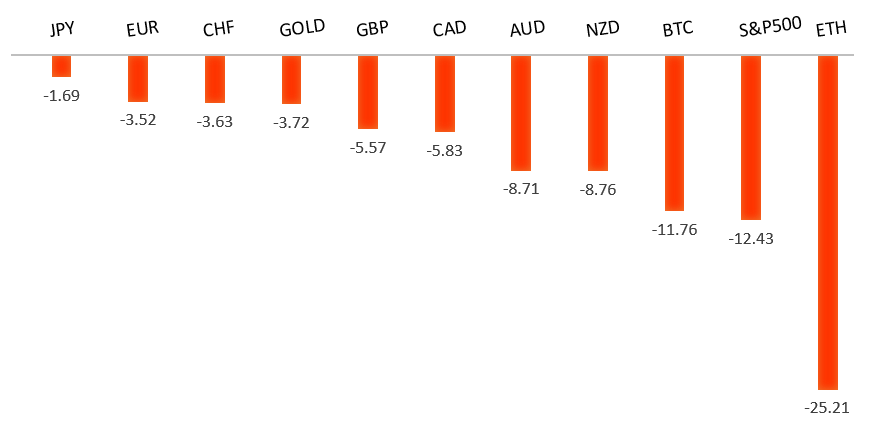
Peformance chart: 30 Day Performance vs. US dollar (%)
Suggested reading
- UK Turmoil Spawns the Return of Bond Vigilantes, M. El-Erian, Bloomberg (October 11, 2022)
- Competition for Arms Technology is Ferocious, A. Gross, Financial Times (October 12, 2022)
Chart talk: Technical & fundamental highlights
Choose pair:
EURUSD – technical overview
Technical studies are turning up from oversold territory, suggesting additional setbacks should be limited in favour of some form of a meaningful correction and consolidation. A weekly close back above parity will take the immediate pressure off the downside.EURUSD – fundamental overview
The Euro was able to steady itself on Tuesday after Berlin refused to support a joint EU debt scheme for loans and energy relief. Key standouts on today’s calendar come from UK GDP, construction output, balance of trade, and industrial production, US producer prices, an ECB Lagarde speech, and the Fed Minutes late in the day.EURUSD - Technical charts in detail
GBPUSD – technical overview
Signs have emerged of the market wanting to put in a longer-term base after collapsing to a record low in September. A break above the September high at 1.1739 will solidify the recovery. Until then, look for setbacks to be well supported ahead of 1.0800.GBPUSD – fundamental overview
The Pound wasn't happy to hear from BOE Bailey on Tuesday, after the central banker warned of serious risk to UK financial stability. The BOE has already intervened in the GILT market multiple times this week, broadening its bond buying program to include inflation-linked bonds. Key standouts on today’s calendar come from UK GDP, construction output, balance of trade, and industrial production, US producer prices, an ECB Lagarde speech, and the Fed Minutes late in the day.USDJPY – technical overview
Technical studies are looking quite stretched on the longer-term chart, warning of consolidation and correction in the days and weeks ahead. Look for additional upside from here to be well capped ahead of 150.00. Next key support comes in at 143.52.USDJPY – fundamental overview
The Yen has extended declines to fresh multi-year low levels, sinking below pre-intervention levels from September. Policy divergence continues to be a big deal here, with yields moving more and more in the US Dollar's favour. Key standouts on today’s calendar come from UK GDP, construction output, balance of trade, and industrial production, US producer prices, an ECB Lagarde speech, and the Fed Minutes late in the day.AUDUSD – technical overview
Overall pressure remains on the downside with the market confined to a well defined downtrend. A break back above 0.6682 would be required to take the pressure off the downside. Until then, scope exists for deeper setbacks towards 0.6000.AUDUSD – fundamental overview
The Australian Dollar has extended its run of declines to a fresh yearly low, on the back of discouraging Westpac consumer confidence, a dip in NAB business confidence, and slumping iron ore prices. Key standouts on today’s calendar come from UK GDP, construction output, balance of trade, and industrial production, US producer prices, an ECB Lagarde speech, and the Fed Minutes late in the day.USDCAD – technical overview
A recent surge back above 1.3000 signals an end to a period of bearish consolidation and suggests the market is in the process of carving out a more significant longer-term base. Next key resistance now comes in up into the 1.4000 area. Setbacks should be very well supported down into the 1.3000 area.USDCAD – fundamental overview
There wasn't any meaningful economic data out of Canada on Tuesday, though this didn't stop the Loonie from extending declines to multi-month lows. What we did see, which definitely contributed to the Canadian Dollar selling was a wave of negative headlines around the Canada housing market. Key standouts on today’s calendar come from UK GDP, construction output, balance of trade, and industrial production, US producer prices, an ECB Lagarde speech, and the Fed Minutes late in the day.NZDUSD – technical overview
Overall pressure remains on the downside with the focus on a retest of the critical low from 2020 at 0.5469. A break back above 0.5814 would be required to take the immediate pressure off the downside.NZDUSD – fundamental overview
The New Zealand Dollar has been slumping of late, but did manage to find some relative outperformance against its peers in recent sessions, this on the back of Australia-New Zealand yield differentials and also on the back of an impressive rebound in New Zealand credit card spending. Key standouts on today’s calendar come from UK GDP, construction output, balance of trade, and industrial production, US producer prices, an ECB Lagarde speech, and the Fed Minutes late in the day.US SPX 500 – technical overview
Longer-term technical studies are in the process of unwinding from extended readings off record highs. Look for rallies to be well capped in favor of lower tops and lower lows. Back above 3922 will be required at a minimum to take the immediate pressure off the downside. Next major support comes in around 3200.US SPX 500 – fundamental overview
We've finally reached a point in the cycle where the Fed recognizes unanchored inflation expectations pose a greater downside risk than over-tightening. This is significant, as it means less investor friendly monetary policy that risks potential recession in the months ahead. Overall, we expect inflation to continue to be a problem in 2022 that results in downside pressure into rallies.GOLD (SPOT) – technical overview
The 2019 breakout above the 2016 high at 1375 was a significant development, opening the door for fresh record highs. Setbacks should now be well supported above 1600 on a monthly close basis ahead of the next major upside extension.GOLD (SPOT) – fundamental overview
The yellow metal continues to be well supported on dips with solid demand from medium and longer-term accounts. These players are more concerned about inflation risk and a less upbeat global growth outlook. All of this should keep the commodity well supported, with many market participants also fleeing to the hard asset as the grand dichotomy of record high equities and record low yields comes to an unnerving climax.