


Next 24 hours: Positioning ahead of major event risk
Today’s report: Busy week ahead
We’ve seen a lot of consolidation in recent sessions, and a lot of this has to do with market positioning into a very busy week. The market will be waiting to see what comes from the Bank of England, ECB, and Fed meetings, and this could inspire plenty of volatility.
Wake-up call
- ECB expectations
- inflation outlook
- caught between
- reopening trade
- BoC pause
- RBNZ outlook
- Inflation headache
- Dealers report
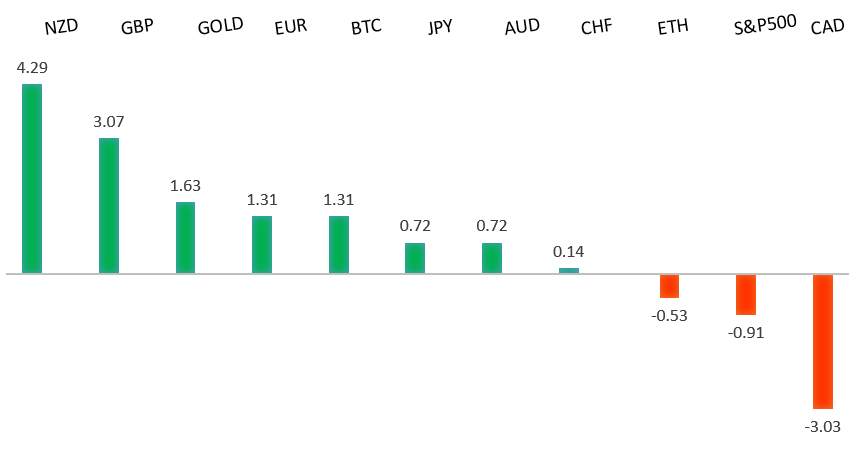
Peformance chart: 30 Day Performance vs. US dollar (%)
Suggested reading
- The Temptation to Call the End of Inflation, J. Authers, Bloomberg (December 12, 2022)
- US bank Branch Closures Widen Social Inequality, V. Kortekaas, Financial Times (December 12, 2022)
Chart talk: Technical & fundamental highlights
Choose pair:
EURUSD – technical overview
A break back above important resistance at 1.0200 suggests the market could be in the process of carving out a longer-term base after sinking to a multi-year low. Look for any setbacks to now be well supported ahead of 0.9900, with only a break back below 0.9730 to compromise the shifting outlook. Next key resistance comes in by previous support at 1.0635.EURUSD – fundamental overview
There wasn't much going on at the end of last week, though we did see the Euro push higher on chatter of a bigger move from the ECB this week. There was some profit taking on Euro longs following an above forecast US PPI print. Key standouts on Monday’s calendar come from UK, GDP, trade, industrial production, and construction output, US consumer inflation expectations, the US monthly budget statement, and a Bank of Canada Macklem speech.EURUSD - Technical charts in detail
GBPUSD – technical overview
Signs have emerged of the market wanting to put in a longer-term base after collapsing to a record low in September. The latest weekly close back above the September high at 1.1739 strengthens this prospect. Any setbacks should now be well supported ahead of 1.1100. Next key resistance comes in at 1.2407.GBPUSD – fundamental overview
The Pound remained supported into the end of last week on the back of a higher UK consumer inflation outlook. The BOE survey showed two-year inflation at 3.4% from 3.2% previous. Key standouts on Monday’s calendar come from UK, GDP, trade, industrial production, and construction output, US consumer inflation expectations, the US monthly budget statement, and a Bank of Canada Macklem speech.USDJPY – technical overview
Longer-term technical studies are in the process of unwinding from severe overbought readings. Look for additional corrective price action back down towards the 130.00 area before the market considers the possibility of uptrend resumption. Rallies should now be well capped ahead of 140.00.USDJPY – fundamental overview
The Yen remains stuck sideways between higher US rates and weak local data. Key standouts on Monday’s calendar come from UK, GDP, trade, industrial production, and construction output, US consumer inflation expectations, the US monthly budget statement, and a Bank of Canada Macklem speech.AUDUSD – technical overview
There are signs of the potential formation of a longer-term base following the recent surge back above 0.6500. The latest weekly close back above previous support now turned resistance at 0.6682 strengthens the outlook for a bullish structural shift.AUDUSD – fundamental overview
The Australian Dollar is better bid on the back of the China reopening trade and higher China stocks. Key standouts on Monday’s calendar come from UK, GDP, trade, industrial production, and construction output, US consumer inflation expectations, the US monthly budget statement, and a Bank of Canada Macklem speech.USDCAD – technical overview
A recent surge back above 1.3000 signals an end to a period of bearish consolidation and suggests the market is in the process of carving out a more significant longer-term base. Next key resistance now comes in up into the 1.4000 area. Setbacks should be very well supported down into the 1.3000 area.USDCAD – fundamental overview
The market hasn't been buying into the Bank of Canada's attempts to walk back on last week's dovish communication at the meeting. There are many that are now looking for the central bank to pause in January. Key standouts on Monday’s calendar come from UK, GDP, trade, industrial production, and construction output, US consumer inflation expectations, the US monthly budget statement, and a Bank of Canada Macklem speech.NZDUSD – technical overview
Overall pressure remains on the downside with risk for the current recovery rally to stall out and form a lower top for the next major downside extension. A break back above 0.6469 would be required to take the immediate pressure off the downside.NZDUSD – fundamental overview
The New Zealand Dollar has held up well of late on more hawkish leaning RBNZ expectations and improved sentiment around the China outlook. Key standouts on Monday’s calendar come from UK, GDP, trade, industrial production, and construction output, US consumer inflation expectations, the US monthly budget statement, and a Bank of Canada Macklem speech.US SPX 500 – technical overview
Longer-term technical studies are in the process of unwinding from extended readings off record highs. Look for rallies to be well capped in favor of lower tops and lower lows. A monthly close back above 4300 will be required at a minimum to take the immediate pressure off the downside. Next major support comes in at 3492.US SPX 500 – fundamental overview
We've finally reached a point in the cycle where the Fed recognizes unanchored inflation expectations pose a greater downside risk than over-tightening. This is significant, as it means less investor friendly monetary policy that risks potential recession in the months ahead. Overall, we expect inflation to continue to be a problem in Q4 2022 and Q1 2023 that results in downside pressure into rallies.GOLD (SPOT) – technical overview
The 2019 breakout above the 2016 high at 1375 was a significant development, opening the door for fresh record highs. Setbacks should now be well supported above 1600 on a monthly close basis ahead of the next major upside extension. This latest break back above 1808 strengthens the bullish outlook.GOLD (SPOT) – fundamental overview
The yellow metal continues to be well supported on dips with solid demand from medium and longer-term accounts. These players are more concerned about inflation risk and a less upbeat global growth outlook. All of this should keep the commodity well supported, with many market participants also fleeing to the hard asset as the grand dichotomy of record high equities and record low yields comes to an unnerving climax.