


Next 24 hours: About flight to safety and flight to quality
Today’s report: Can't escape the pain
The market can’t get away from geopolitical risk worry, as tension in the Middle East persists. Meanwhile, risk sentiment is taking an added hit on fear over the impact of higher for longer Fed policy at a time when investors are begging for relief.
Wake-up call
- German survey
- distributive trades
- Verbal intervention
- higher inflation
- dovish hold
- Sentiment deterioration
- Geopolitical risk
- Global outlook
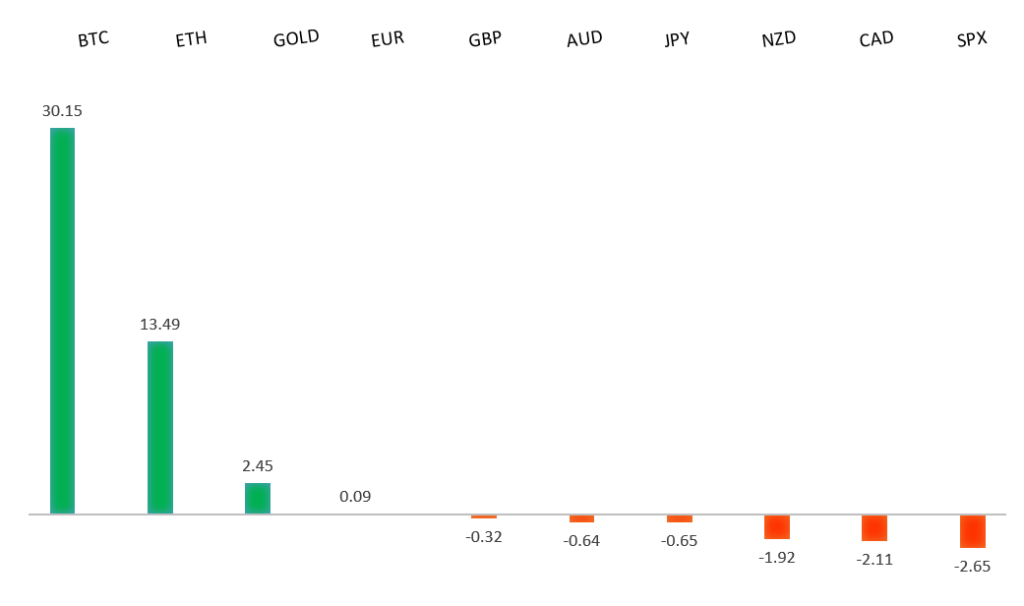
Peformance chart: 30 Day Performance vs. US dollar (%)
Suggested reading
- What Did We Learn From the Pandemic Bull Market?, J. Rekenthaler, Bloomberg (October 23, 2023)
- Al Gore on Big Oil, COP28, and Climate Action, S. Mundy, Financial Times (October 25, 2023)
Chart talk: Technical & fundamental highlights
Choose pair:
EURUSD – technical overview
Any additional setbacks should be well supported on dips below 1.0500 in favor of the start to the next major upside extension. Ultimately, only a monthly close back below 1.0500 would give reason for concern. Back above 1.0770 will take the immediate pressure off the downside.EURUSD – fundamental overview
The Euro remains under pressure on account of broad based US Dollar demand, but has been trying to hold up relatively well after German survey data improved on Wednesday. We're also seeing some positioning ahead of today's key central bank event risk. Key standouts on Thursday’s calendar come from UK CBI distributive trades, the ECB policy decision, Canada weekly earnings and manufacturing sales, US durable goods, GDP, durable goods, initial jobless claims, and pending home sales.EURUSD - Technical charts in detail
GBPUSD – technical overview
Signs have emerged of the market wanting to put in a longer-term base after collapsing to a record low in September 2022. The November 2022 monthly close back above 1.2000 strengthens this prospect. Any setbacks should now be well supported ahead of 1.2000. Next key resistance comes in at 1.3143.GBPUSD – fundamental overview
The Pound has been under pressure this week on broad based US Dollar demand and in the aftermath of a round of weak UK economic data highlighted by a rise in jobless claims, dive in CBI numbers, and discouraging PMIs. Key standouts on Thursday’s calendar come from UK CBI distributive trades, the ECB policy decision, Canada weekly earnings and manufacturing sales, US durable goods, GDP, durable goods, initial jobless claims, and pending home sales.USDJPY – technical overview
At this stage, it looks like the market is wanting to resume the bigger picture uptrend and head back towards a retest of that multi-year high from October 2022 up at 151.95. Look for any weakness to continue to be well supported on dips.USDJPY – fundamental overview
All of the talk around the market contemplating a possible shift in BOJ policy next week has gone out the window. The Yen has continued to extend declines, to the point where it's fully expected to start hearing more verbal intervention threats in the sessions ahead. Key standouts on Thursday’s calendar come from UK CBI distributive trades, the ECB policy decision, Canada weekly earnings and manufacturing sales, US durable goods, GDP, durable goods, initial jobless claims, and pending home sales.AUDUSD – technical overview
There are signs of the potential formation of a longer-term base with the market trading down into a meaningful longer-term support zone. Only a monthly close below 0.6200 would give reason for rethink. Back above 0.6523 will take the immediate pressure off the downside and strengthen case for a bottom.AUDUSD – fundamental overview
The Australian Dollar hasn't been able to avoid extending to fresh yearly lows against the Buck, even in the face of Wednesday's hotter Aussie inflation. Risk off flow and broad Dollar demand have been the more powerful force. Key standouts on Thursday’s calendar come from UK CBI distributive trades, the ECB policy decision, Canada weekly earnings and manufacturing sales, US durable goods, GDP, durable goods, initial jobless claims, and pending home sales.USDCAD – technical overview
Above 1.3000 signals an end to a period of longer-term bearish consolidation and suggests the market is in the process of carving out a more significant longer-term base. Next key resistance now comes in up into the 1.4000 area. Setbacks should be very well supported down into the 1.3000 area.USDCAD – fundamental overview
Wednesday's dovish Bank of Canada hold caught many market participants off guard. The central bank said there was growing evidence past rate increases dampened economic activity and price pressures, while cut GDP forecasts by half. Key standouts on Thursday’s calendar come from UK CBI distributive trades, the ECB policy decision, Canada weekly earnings and manufacturing sales, US durable goods, GDP, durable goods, initial jobless claims, and pending home sales.NZDUSD – technical overview
Overall pressure remains on the downside with the market once again stalling out on a run up into the 0.6500 area. Ultimately, a break back above 0.6049 would be required to take the immediate pressure off the downside. A monthly close below 0.5800 will intensify bearish price action.NZDUSD – fundamental overview
The New Zealand Dollar hasn't been able to escape the intense risk off flow in global markets, extending its run of 2023 lows. Key standouts on Thursday’s calendar come from UK CBI distributive trades, the ECB policy decision, Canada weekly earnings and manufacturing sales, US durable goods, GDP, durable goods, initial jobless claims, and pending home sales.US SPX 500 – technical overview
Longer-term technical studies are in the process of unwinding from extended readings off record highs. Look for rallies to be well capped in favor of lower tops and lower lows. A monthly close back above 4600 will be required to take the immediate pressure off the downside. Next key support comes in at 4200.US SPX 500 – fundamental overview
Investors continue to struggle with the reality of a higher for longer Fed policy track in the face of ongoing worry around inflation, while also contending with an escalation in geopolitical risk. Overall, we expect inflation to continue to be a problem in 2023 that results in downside pressure into rallies despite market expectations that would argue otherwise.GOLD (SPOT) – technical overview
The 2019 breakout above the 2016 high at 1375 was a significant development, opening the door for fresh record highs. Setbacks should now be well supported above 1600 on a monthly close basis ahead of the next major upside extension. Next major resistance comes in at 2100, above which opens the next extension towards 2500.GOLD (SPOT) – fundamental overview
The yellow metal continues to be well supported on dips with solid demand from medium and longer-term accounts. These players are more concerned about inflation risk and a less stable and upbeat global growth outlook. All of this should keep the commodity well supported, with many market participants also fleeing to the hard asset as the grand dichotomy of record high equities and record low yields comes to an unnerving climax.