


Today’s report: Choppy directionless conditions in thin trade
There wasn’t much activity in markets on Tuesday on account of the razor thin holiday trade. UK, Canada, Australia, New Zealand, and Hong Kong markets were all closed, which added to the lighter conditions.
Wake-up call
- Hawkish ECB
- GBPUSDLight activity with UK on holiday
- dovish BOJ
- quarantine measures
- Canada resilience
- investor appetite
- Inflation headache
- Dealers report
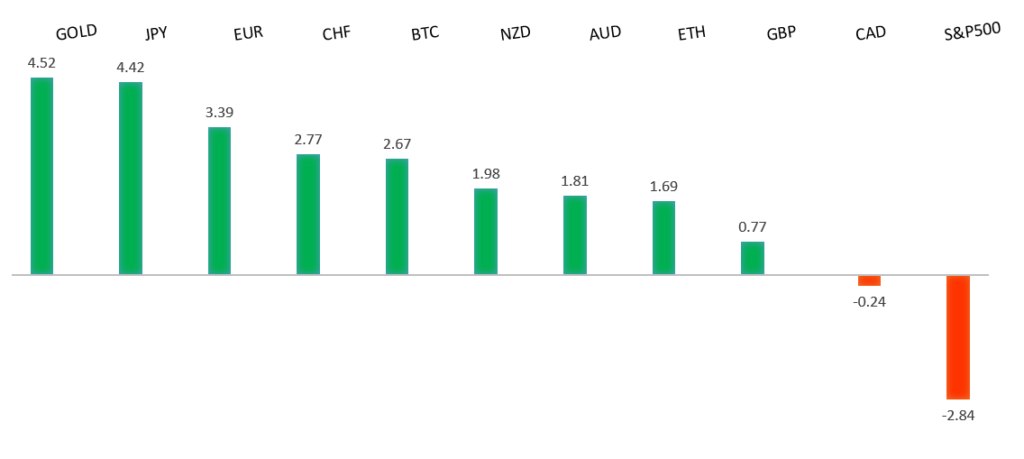
Peformance chart: 30 Day Performance vs. US dollar (%)
Suggested reading
- The Junk Bond Reckoning Is Coming in 2023, J. Levin, Bloomberg (December 27, 2022)
- Private Equity Facing Antitrust Showdown, S. Palma, Financial Times (December 22, 2022)
Chart talk: Technical & fundamental highlights
Choose pair:
EURUSD – technical overview
The Euro recovery has finally run back above meaningful previous support turned resistance at 1.0635. But we'll need to see a monthly close above this level to suggest the market has established a longer-term base. Inability to hold above 1.0635 on a monthly close basis could open the door for a resumption of declines.EURUSD – fundamental overview
The Euro has been slightly better bid of late, mostly on the back of hawkish ECB rhetoric. On Monday, ECB Knott said the central bank would continue to raise rates as the risk of doing too little remained the greater risk. Key standouts on Wednesday’s calendar come from US pending home sales, Richmond Fed manufacturing, and Dallas Fed services.EURUSD - Technical charts in detail
GBPUSD – technical overview
Signs have emerged of the market wanting to put in a longer-term base after collapsing to a record low in September. The latest weekly close back above the September high at 1.1739 strengthens this prospect. Any setbacks should now be well supported ahead of 1.1100. Next key resistance comes in at 1.2668.GBPUSD – fundamental overview
No major updates out of the UK, with markets closed for holidays and all expected to be quiet until activity picks up into the middle of next week. Key standouts on Wednesday’s calendar come from US pending home sales, Richmond Fed manufacturing, and Dallas Fed services.USDJPY – technical overview
Longer-term technical studies are in the process of unwinding from severe overbought readings. Look for additional corrective price action back down towards the 126.00 area before the market considers the possibility of uptrend resumption. Rallies should now be well capped ahead of 140.00.USDJPY – fundamental overview
A round of soft Japan economic data and a dovish BOJ Summary of Opinions have been behind the latest round of declines in the Yen. Key standouts on Wednesday’s calendar come from US pending home sales, Richmond Fed manufacturing, and Dallas Fed services.AUDUSD – technical overview
There are signs of the potential formation of a longer-term base following the recent surge back above 0.6500. The latest weekly close back above previous support now turned resistance at 0.6682 strengthens the outlook for a bullish structural shift.AUDUSD – fundamental overview
Most of this latest wave of Aussie demand has come from the news that China is scrapping quarantine measures. Key standouts on Wednesday’s calendar come from US pending home sales, Richmond Fed manufacturing, and Dallas Fed services.USDCAD – technical overview
A recent surge back above 1.3000 signals an end to a period of bearish consolidation and suggests the market is in the process of carving out a more significant longer-term base. Next key resistance now comes in up into the 1.4000 area. Setbacks should be very well supported down into the 1.3000 area.USDCAD – fundamental overview
The Canada economy has shown signs of resilience into year end, potentially bolstering the case for the central bank to continue raising borrowing costs. Preliminary data suggest gross domestic product expanded 0.1% in November. That followed a 0.1% gain in October, matching the median estimate in a Bloomberg survey of economists, and an upwardly revised increase of 0.2% in September. The October and November gains suggest Canada's growth is holding up better than expected. The economy is on track to expand at an annualized rate of 1.2% in the fourth quarter. Key standouts on Wednesday’s calendar come from US pending home sales, Richmond Fed manufacturing, and Dallas Fed services.NZDUSD – technical overview
Overall pressure remains on the downside with risk for the current recovery rally to stall out and form a lower top for the next major downside extension. A break back above 0.6577 would be required to take the immediate pressure off the downside.NZDUSD – fundamental overview
There hasn't been much going on out of New Zealand in the end of year holiday trade. Most of the price action here has revolved around correlations with broader market sentiment. Key standouts on Wednesday’s calendar come from US pending home sales, Richmond Fed manufacturing, and Dallas Fed services.US SPX 500 – technical overview
Longer-term technical studies are in the process of unwinding from extended readings off record highs. Look for rallies to be well capped in favor of lower tops and lower lows. A monthly close back above 4300 will be required at a minimum to take the immediate pressure off the downside. Next major support comes in at 3492.US SPX 500 – fundamental overview
We've finally reached a point in the cycle where the Fed recognizes unanchored inflation expectations pose a greater downside risk than over-tightening. This is significant, as it means less investor friendly monetary policy that risks potential recession in the months ahead. Overall, we expect inflation to continue to be a problem in H1 2023 that results in downside pressure into rallies.GOLD (SPOT) – technical overview
The 2019 breakout above the 2016 high at 1375 was a significant development, opening the door for fresh record highs. Setbacks should now be well supported above 1600 on a monthly close basis ahead of the next major upside extension. This latest break back above 1808 strengthens the bullish outlook.GOLD (SPOT) – fundamental overview
The yellow metal continues to be well supported on dips with solid demand from medium and longer-term accounts. These players are more concerned about inflation risk and a less upbeat global growth outlook. All of this should keep the commodity well supported, with many market participants also fleeing to the hard asset as the grand dichotomy of record high equities and record low yields comes to an unnerving climax.